
The chart looks perfect right up until a rate decision wipes out the setup in minutes.
That is the reality of forex trading: technical analysis can point to entry and exit levels, while fundamental analysis can change the story behind the move before price even reacts.
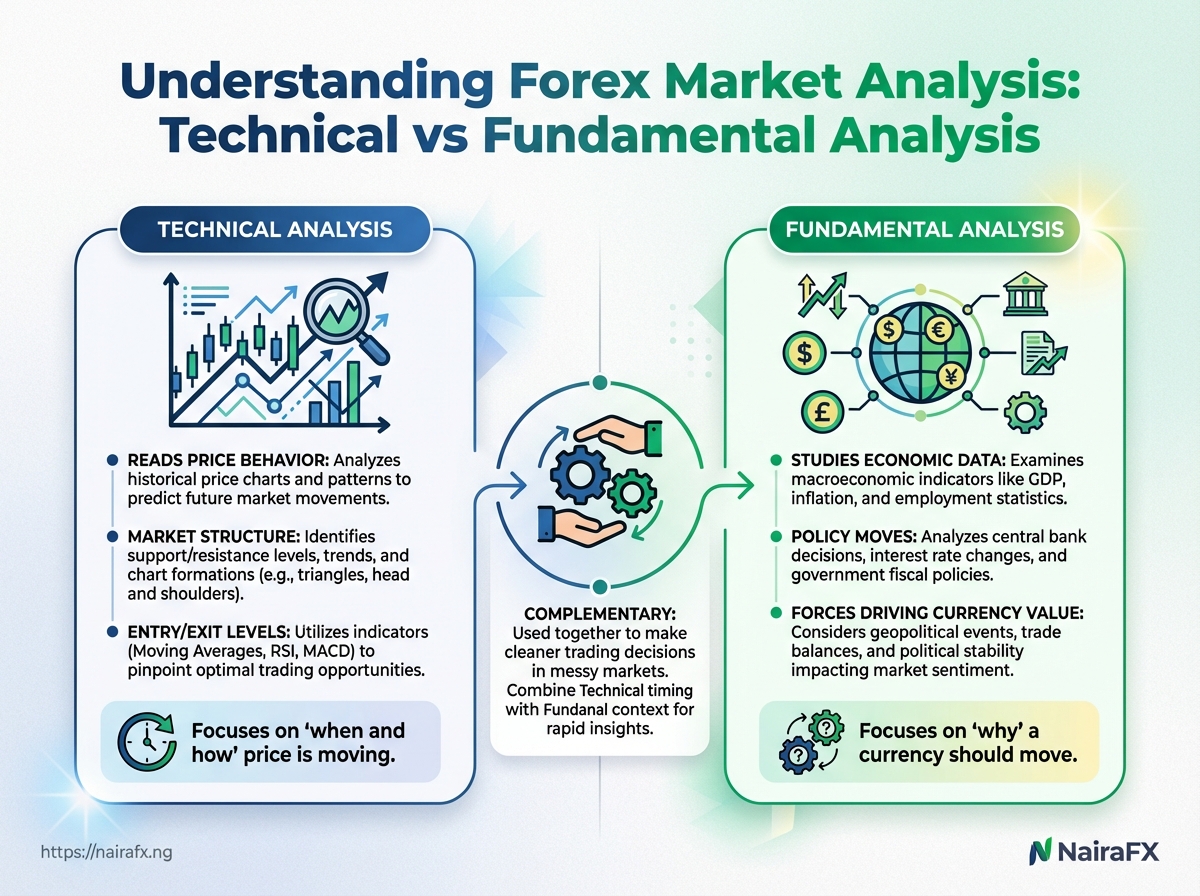
Traders often treat these as rival camps, but they solve different problems.
One reads price behavior and market structure, the other studies economic data, policy moves, and the forces that push a currency higher or lower.
That split matters more in forex than in many other markets.
A clean trend on EUR/USD can suddenly stall because of inflation data, a central bank comment, or risk sentiment tied to global news.
Good forex analysis methods are rarely about choosing one side forever.
The sharper question is which method fits the trade, the timeframe, and the kind of market you are facing right now.
A short-term scalp on the London open needs a different lens from a position trade built around an interest rate cycle.
Quick Answer: Use technical analysis to structure your trade (support/resistance, momentum, entry triggers) and use fundamental analysis to judge whether the move is likely to stick or be disrupted by events like central bank decisions and inflation surprises. Your best forex trading plan matches the method to your timeframe—for example, shorter-term scalps focus on scheduled data shocks and immediate market reaction, while longer-term trades align with interest-rate cycles. Most importantly: define your bias before you act, then use the other method only to confirm (or invalidate) that bias when price reaches your planned trigger.
What Forex Market Analysis Really Means
Why do so many traders keep asking whether technical analysis or fundamental analysis works best? Because they are really asking a deeper question: how do you decide when to enter, when to back off, and when a trade is no longer worth the risk.
In forex, analysis is not decoration.
It is the structure behind a trade plan, and it shapes everything from entry timing to stop-loss placement and exit rules.
Technical analysis looks at price behavior on charts, while fundamental analysis digs into the economic and policy forces behind a currency move.
That split is well established in the trading world, and it explains why the two methods are often used together rather than treated like rivals, as described in Markets4You’s guide to technical vs. fundamental analysis in forex and AvaTrade’s market analysis overview.
- Technical analysis: Useful for spotting structure, support and resistance, momentum, and likely entry zones.
- Fundamental analysis: Useful for understanding why a currency may strengthen or weaken over time.
- Trade planning: Helps define entry,
stop-loss, andtake-profitlevels before emotion gets involved.
- Risk control: Keeps position size tied to market conditions, not gut feel.
- Nigerian context: Helps traders stay alert to naira swings, policy surprises, and fast-moving global news.
For Nigerian traders, that last point matters a lot.
Volatility can come from local policy shifts, inflation data, central bank decisions, or a sudden move in the dollar.
A trader who reads both the chart and the news is usually better placed to avoid chasing a spike too late.
That balance is why the “best” analysis method is usually the one that matches the trade style and the holding period.
Short-term traders lean harder on chart behavior, while longer-term traders need the economic story behind the move, which lines up with the distinction explained by IG’s comparison of fundamental and technical analysis.
At NairaFX, we keep that same practical angle in mind: the goal is not to sound clever, but to make cleaner decisions in messy markets.
Good analysis does not remove uncertainty; it gives that uncertainty a shape you can actually trade around.
Technical Analysis Explained
Have you ever looked at a forex chart and felt like it was talking, just not in plain English? That is basically the appeal of technical analysis.
It reads price action, repeats in human behavior, and the marks traders leave behind on charts.
Unlike fundamental analysis, which asks why a currency should move, technical analysis focuses on when and how price is moving.
IG notes that this style is often used to fine-tune shorter-term trades, while price itself becomes the main clue. IG’s explanation of technical vs. fundamental analysis
How price action tells the story
A chart is not magic.
It is just a record of buyers and sellers reacting in real time.
That reaction often shows up as trends, breakouts, and reversals.
Markets4You describes technical analysis as one of the two main forex analysis methods traders use to study market movement and forecast direction.
Markets4You on technical vs. fundamental analysis in forex
The tools traders lean on
Traders usually do not rely on one signal alone.
They stack a few tools together and look for agreement.
- Trend lines: These help spot the market’s direction and the pace of that move.
- Support and resistance: These are price zones where buying or selling pressure often shows up again.
- Indicators: Tools like moving averages, RSI, and MACD help measure momentum, strength, and possible turning points.
- Chart patterns: Formations such as triangles, flags, and double tops can hint at continuation or reversal.
What it can tell us, and where it falls short
Technical analysis can show where price has reacted before, where momentum is fading, and where a breakout might be forming.
It can also help traders plan entries, exits, and risk around clear price levels.
It cannot tell the full story, though.
A surprise rate decision, policy shift, or liquidity squeeze can blow through a neat chart setup in seconds, which is why many traders pair it with broader forex analysis methods instead of treating it like a crystal ball.
Babypips makes the same basic point: charts help with timing, but they do not explain the economic forces underneath.
Babypips on technical analysis vs. fundamental analysis
Technical analysis works best when it stays humble.
Price leaves clues, not guarantees, and that is exactly why it remains useful.
Fundamental Analysis Explained
Why does a currency sometimes leap on a headline and shrug off a chart pattern? Because fundamental analysis follows the real forces behind a currency: inflation, interest rates, employment, and central bank policy.
That is why this side of forex analysis methods feels less like pattern-spotting and more like reading the mood of an economy.
AvaTrade describes it neatly as asking why an asset should move, while technical analysis asks when it might move AvaTrade’s explanation of fundamental and technical market analysis.
IG makes the same distinction, noting that fundamental analysis tends to focus on longer-term value and technical analysis on shorter trade timing IG’s guide to fundamental vs technical analysis.
For a trader, the news calendar matters because markets price expectations first and headlines second.
A strong inflation print can push rate expectations higher, and that can lift a currency long before the next policy meeting.
The news that moves the needle
- Inflation: Higher inflation often forces markets to price tighter policy, especially when it stays sticky.
- Interest rates: Central bank rates shape yield demand. Even a small surprise can move a pair fast.
- Jobs data: Strong employment usually signals a resilient economy, which can support the currency.
- Central bank decisions: Rate statements, vote splits, and forward guidance often matter more than the rate change itself.
> As of 2026, traders still watch central bank language as closely as the actual decision, because wording can shift expectations before any policy move lands.
Where the reading gets messy
Fundamentals can tell us direction, but not always timing.
A currency may look “strong” on paper and still fall hard if the market expected something stronger.
It also gets tricky when several forces collide.
Good inflation data can clash with weak jobs numbers, and a central bank can sound hawkish while warning about growth at the same time.
That is where interpretation matters more than certainty.
Fundamental analysis is best at explaining the story behind price, but the story is rarely tidy, especially when markets are nervous.
For traders who want the bigger picture, that tension is the useful part.
It keeps us from treating headlines like magic and reminds us that price still has the final vote.
Technical vs Fundamental Analysis: Side-by-Side Comparison
If two traders stare at the same EUR/USD chart and disagree, the issue is usually timing, not intelligence. Technical analysis and fundamental analysis answer different questions, so they often point in different directions at the same moment.
A clean way to think about it is this: technical analysis looks for when price may move, while fundamental analysis tries to explain why it should move.
That distinction shows up again in AvaTrade’s market analysis guide and IG’s comparison of fundamental and technical analysis, where technical methods are tied more closely to shorter-term trade timing.
That split matters for style too.
A scalper needs fast, repeatable decisions, so chart levels and momentum matter most.
A swing trader can give the market more room, which makes economic context and policy expectations more useful.
Main differences in practice
Market conditions change the balance.
In a quiet range, technical levels can carry more weight.
During a surprise rate decision or inflation release, fundamentals can bulldoze neat chart patterns, which is why Markets4You’s forex analysis comparison treats them as complementary rather than competing ideas.
That is the real test.
Good forex analysis methods are not about picking a camp; they are about matching the tool to the market mood.
What happens when the chart says “buy,” but the headlines suggest “wait”? You need a plan hierarchy—where one method decides the broader setup, and the other provides the execution rules.
A practical way to combine them is:
- Fundamentals: define the scenario (what the market is likely pricing and what could change expectations).
- Technicals: provide the execution trigger (where you’ll act, confirm, and stand aside if the move doesn’t materialize).
This routine starts before the session opens. Check the economic calendar, note which currencies are most exposed, then mark the chart levels that matter for your entry. If the scenario is bullish for a currency pair, use the chart to find a pullback, breakout, or rejection at a defined area—rather than chasing price in the middle of a move.
A simple routine for combining both methods
| Stage | What to Check | Why It Matters | Action |
|---|---|---|---|
| Before the session | Scheduled news, central bank comments, and current market bias | Sets the expectations and helps you choose a realistic direction for the day | Pick one or two pairs and write the scenario in plain English |
| Before opening a trade | Support, resistance, trend direction, and candle structure | Helps ensure your entry aligns with market structure | Enter only when price reaches a planned level and confirms your idea |
| After a news release | Whether price accepted, rejected, or ignored the data | Shows whether the market’s interpretation matches your scenario | Reassess the trade instead of forcing the original plan |
| Before closing a trade | Whether momentum is fading, target is near, or new scheduled news is approaching | Prevents giving back gains when conditions change | Scale out, adjust, or exit if the setup clearly no longer fits |
One habit that makes this easier: write a one-line plan before you trade—scenario, trigger, invalidation. Simple beats complicated when markets are moving fast.
Common Mistakes Traders Make With Forex Analysis
Why do some traders keep getting the direction right and still lose money? Because the mistake is often not the forecast.
It is the way the forecast gets used.
One of the biggest problems is treating technical analysis or fundamental analysis like a one-size-fits-all tool.
IG notes that fundamental analysis tends to suit longer-term thinking, while technical analysis is usually better for shorter trade timing, so forcing one method into every market condition is asking for trouble. IG’s comparison of fundamental and technical analysis
Another trap is staring so hard at the setup that risk gets ignored.
A clean entry means very little if the stop is random, the size is too large, or the account can’t survive a bad streak.
That is where a lot of otherwise smart traders get knocked out.
News creates its own chaos.
A CPI release, central bank comment, or surprise rate shift can rip through a chart pattern in seconds, and traders who force the old setup anyway usually pay for it.
Sources like AvaTrade’s 2026 market analysis guide and Babypips’ forex analysis overview both point to the same idea: timing and context matter just as much as the method itself.
- Using one method everywhere: Trend-following chart tools can work well in calm conditions, but they often fail when volatility jumps.
- Ignoring position size: A good analysis can still blow up a small account if the trade is oversized.
- Chasing news candles: Sharp moves after data releases are often noise first, direction second.
- Forcing patterns: A rectangle or head-and-shoulders shape is not valid just because you want it to be.
- Confusing bias with evidence: Wanting EUR/USD to rise is not the same as seeing proof it should.
A simple habit helps.
Before entering a trade, ask whether the market is trending, ranging, or reacting to fresh news.
Then match the analysis method to that condition instead of marrying one approach forever.
At NairaFX, we see this mistake often among traders who are technically sharp but still inconsistent.
Clean analysis matters, but clean thinking about risk matters more.
Choosing the Right Analysis Approach for Your Trading Style
A trader can have the right signal and still pick the wrong method for the job.
That happens when the analysis fits the market, but not the person using it.
Technical analysis usually suits traders who need timing and repeatability. Fundamental analysis fits traders who care more about the bigger story behind a currency pair.
Sources like IG’s guide on fundamental vs technical analysis and AvaTrade’s market analysis overview make the same point in different words: one method leans toward “when,” the other toward “why.”
For Nigerian traders, that choice gets sharper because daily life matters.
If you can only check the market after work, a slower style usually makes more sense than chasing every tick.
Match your method to your time frame
A day trader needs a different lens from a position trader.
If your trades last minutes or hours, chart structure, momentum, and intraday levels matter more.
If your trades last days or weeks, macro themes, policy shifts, and rate expectations become harder to ignore.
That is why Markets4you’s forex analysis guide treats the two methods as tools for different jobs, not rival religions.
- Short-term trades: Favor price action, volatility, and clean entry rules.
- Swing trades: Use chart signals, but check the news calendar first.
- Position trades: Spend more time on economic trends and policy direction.
Questions to ask before trusting a signal
A signal is only useful if it matches your process.
One pretty arrow on a chart can still be a bad trade.
Before acting, ask:
- Does this fit my holding period? A five-minute setup is useless if you plan to hold for two weeks.
- What would invalidate it? Every trade needs a point where the idea is wrong.
- Does the market have room to move? Crowded trades often stall fast.
- Is there a news event nearby? Headlines can wreck an otherwise clean setup.
Build confidence through repetition
Confidence comes from seeing the same method work across many trades, not from one lucky win.
At NairaFX, we often see traders improve faster when they keep one simple rule set and review it honestly.
A practical rhythm works well: journal the setup, note the reason for entry, then compare the result with the original plan.
Over time, that habit shows whether your forex analysis methods suit your style or just look good on paper.
A method that fits your time frame will feel less exciting and more usable.
That is usually the better trade.
The key takeaway is this: technical and fundamental analysis aren’t competitors—they’re two different inputs to the same decision.
To make them work together, don’t ask which one is “better.” Ask whether your plan stays consistent across:
1) Story (Fundamentals): what the market is pricing and which drivers matter today. 2) Trigger (Technicals): where price confirms—or fails to confirm—your idea. 3) Risk (Both): the exact limit for loss if the move goes wrong.
This is the same logic you’ll build in Section 9—use it as a quick quality-check before every entry.
When they disagree
If fundamentals point one way but the chart doesn’t offer a clean trigger (or the invalidation level makes the risk unworkable), don’t force the trade. Either:- wait for alignment, or
- adjust the setup (pair, level, or timing) so the trigger and risk still make sense.
Build one rule today
Before your next entry, confirm that your trigger and your macro story match—and that your risk plan still holds if price moves sharply without giving you the pattern you expected.Patience isn’t exciting, but it’s what keeps small mistakes from becoming expensive lessons.