
Your chart can look calm right before it snaps.
That is where technical analysis in forex earns its keep, because price often leaves clues before the crowd notices them.
Most traders first meet the market through noise: random candles, messy moves, and opinions flying everywhere. Forex trading techniques that depend only on instinct tend to feel clever right up until the account takes a hit.
Chart patterns in forex are not magic.
They are simply repeated price shapes that hint at pressure building, pausing, or breaking.
A triangle, a double top, or a trend line break can reveal far more than a dozen loud predictions.
The trick is reading those clues without worshipping them.
Technical analysis works best when it is treated like a map, not a crystal ball, especially in fast markets where false moves love to tease impatient traders.
That is why good traders focus on context, not just signals.
They want to know when a pattern matters, when it fails, and how much risk sits underneath the setup before they press the button.
Quick Answer: Technical analysis in forex is a structured way to translate what price is already doing into a trade plan. Instead of relying on guesses, we use: – Chart patterns and price action to spot where buying/selling pressure is building, pausing, or failing. – Key levels (supply/demand) to identify likely stall points, break zones, and retest areas. – Confirmation tools (e.g., moving averages, RSI, MACD) to check whether momentum and trend behavior match the setup. Your edge comes from defining the “proof” up front—what must happen on the chart, where you’ll invalidate the idea, and how much you’ll lose if you’re wrong—so decisions stay repeatable even when Nigerian market conditions get noisy.
What is technical analysis and why it matters in forex
Are you reading the market, or just decorating guesses with indicators?
Technical analysis in forex is the habit of studying price behavior to spot likely moves.
It looks at price action, chart patterns in forex, and tools like moving averages or momentum signals, instead of trying to guess where price should go based on opinions.
That matters because markets leave footprints.
According to Forex.com’s chart patterns guide, chart patterns repeat because traders keep reacting in familiar ways.
And OANDA’s technical analysis guide on chart patterns describes them as a collective view of how traders see the market at a given time.
In plain English, price often shows fear, greed, hesitation, and breakout pressure before the news feels obvious.
That is why technical analysis forex traders care about is less about magic and more about probability.
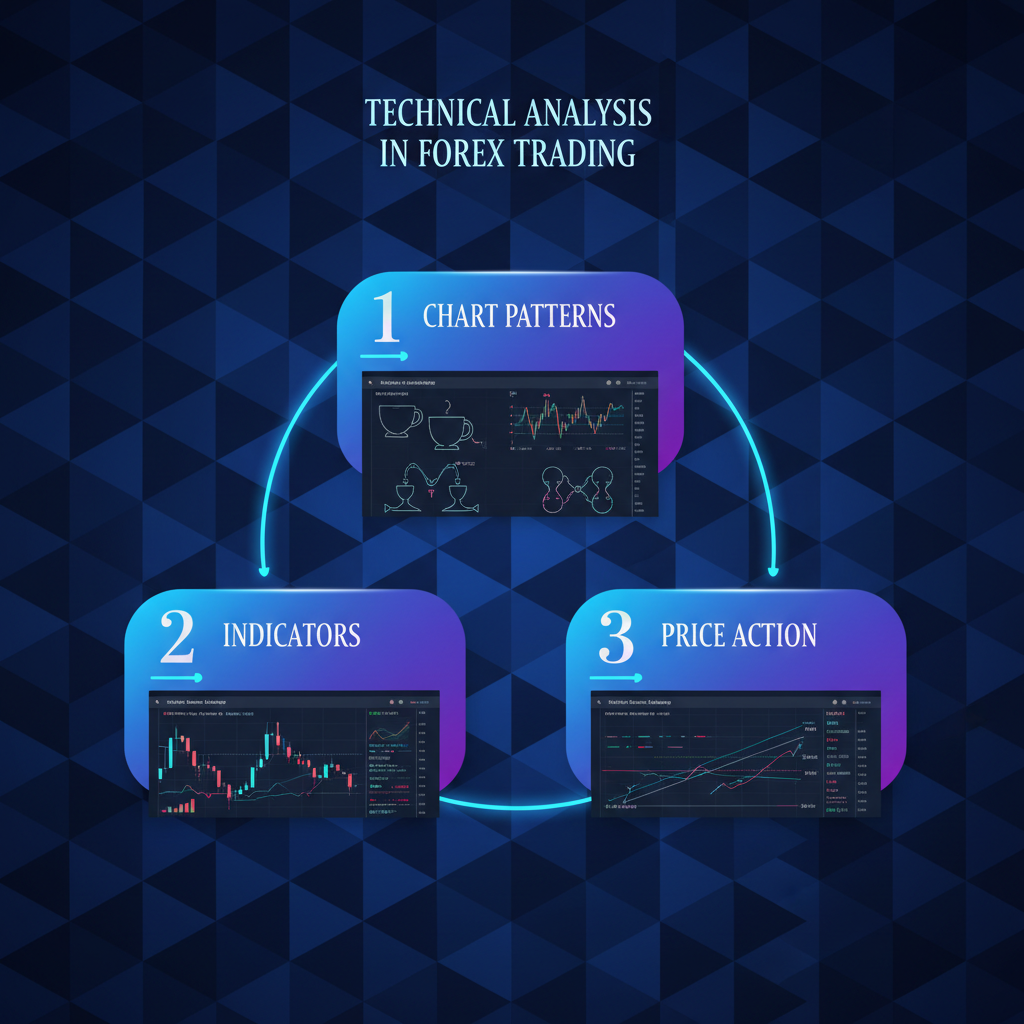
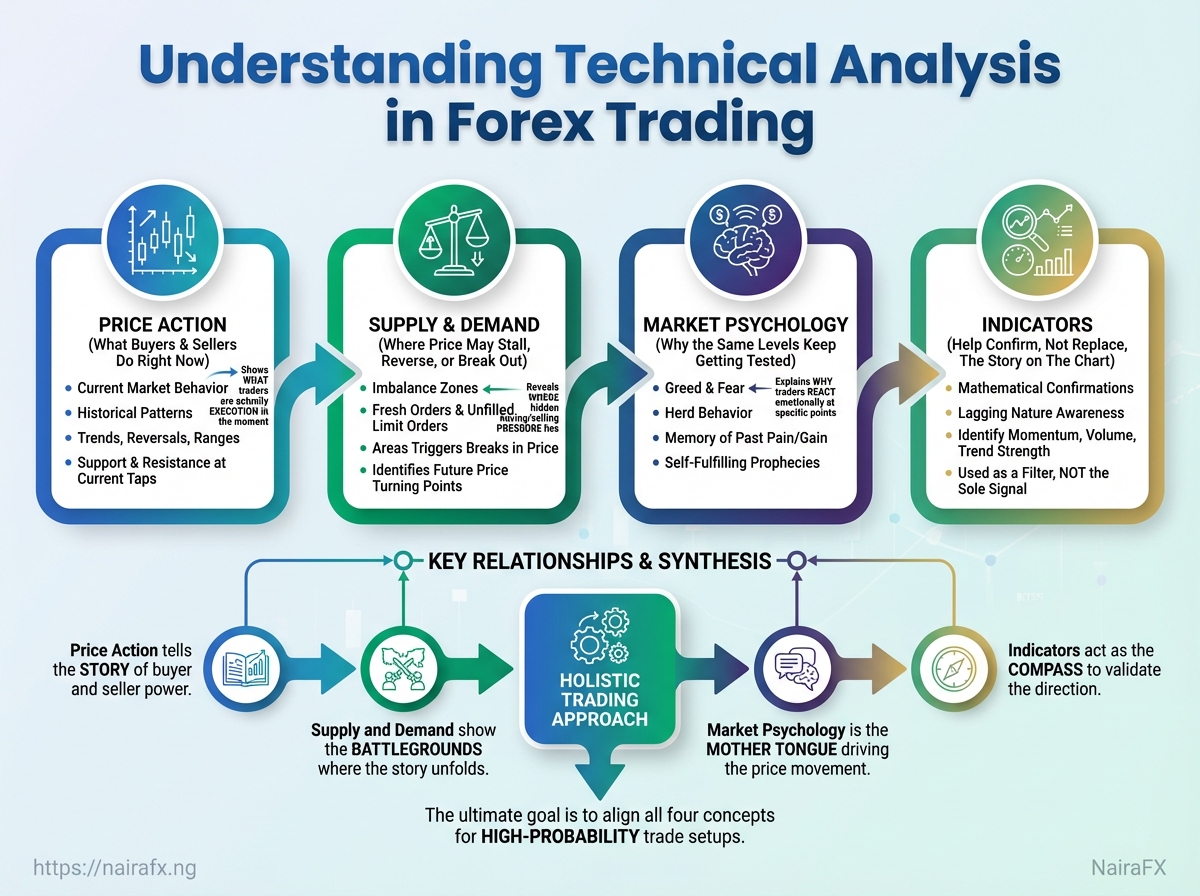
A simple way to think about it is this:
- Price action shows what buyers and sellers are doing right now.
- Supply and demand explain where price may stall, reverse, or break out.
- Market psychology explains why the same levels keep getting tested.
- Indicators help confirm, not replace, the story on the chart.
Forex Tester’s 2026 chart patterns guide notes that candlestick charts remain the most popular because their bodies and wicks show the struggle inside each session.
That detail matters when a candle rejects a level or closes with conviction.
Those tiny clues often matter more than a loud headline.
For Nigerian traders, the real edge comes from pairing this with basic fundamentals.
A central bank decision, inflation print, or dollar move can set the direction, but technical analysis helps with timing.
It tells you whether the market is already reacting, pausing, or preparing for another leg.
A lot of the best forex trading techniques do not ask, “Will the market move?” They ask, “Where is the crowd likely to act next?” That is the difference between noise and a setup.
Technical analysis does not predict the future.
It gives structure to uncertainty, and in forex that structure is worth a lot.
Essential chart types and timeframes
Ever switched from a line chart to candlesticks and felt the market suddenly had a pulse? That jump matters more than it looks.
In technical analysis forex, the chart style changes how much context you can see, and that changes the trades you notice.
A line chart is clean and fast.
A bar chart gives you open, high, low, and close in one glance. Candlesticks do the same job, but with more visual weight, which is why they remain the go-to choice for many traders studying chart patterns in forex; the body and wicks make price struggle easier to read, as noted in 2026 chart patterns guide.
Timeframe choice is where most traders either get sharp or get noisy.
Intraday traders often live on lower frames like M5 or M15, swing traders usually watch H4 and D1, and position traders care more about weekly structure than the next candle.
That mix matters because chart patterns only mean something when the market has enough room to form them, a point echoed in OANDA’s guide to chart patterns in technical analysis and FOREX.com’s chart pattern overview.
- Line charts: Best for spotting broad trend direction without distractions.
- Candlestick charts: Best for entry timing, reversals, and candle-by-candle pressure.
- Bar charts: Best for traders who want full price data with less visual clutter than candlesticks.
- Intraday timeframes: Good for fast decisions, but they punish impatience.
- Swing timeframes: Better for cleaner setups and fewer false moves.
- Position timeframes: Useful when the bigger market structure matters more than daily noise.
The smartest move is to align frames instead of picking one and worshipping it.
A higher timeframe can show the trend, while a lower timeframe can fine-tune the entry, which is a simple habit that improves many forex trading techniques without making the process complicated.
Used well, chart choice and timeframe choice turn noise into structure.
Used badly, they turn a decent setup into a mess.
Core indicators and how traders use them
Which indicator should a trader trust first? None of them, alone.
In technical analysis forex, moving averages point to direction, RSI shows momentum pressure, MACD tracks trend shifts, and volume tells you whether the move has real backing.
That mix matters because each tool answers a different question, and good forex trading techniques use that separation instead of forcing one indicator to do everything.
According to HYCM’s technical analysis guide, technical analysis leans on past price action and volume.
OANDA’s chart patterns guide also describes chart patterns as a collective view of how traders see the market.
Indicators work best when they turn that crowd behavior into cleaner signals.
How the main indicators actually behave
| Indicator | Primary signal | Best timeframe | Strengths | Limitations |
|---|---|---|---|---|
| SMA | Trend direction and smoothing | Swing to long-term charts | Clean, easy to read, good for trend bias | Lags badly in fast markets |
| EMA | Faster trend direction | Intraday to swing charts | Reacts faster than SMA, useful in changing trends | More sensitive to noise |
| RSI | Momentum and overbought/oversold pressure | Most timeframes | Great for spotting stretched moves | Can stay extreme in strong trends |
| MACD | Trend momentum and possible reversals | 4H and above, also swing trading | Helps confirm shifts in direction | Signals can arrive late |
| OBV | Volume-backed buying or selling pressure | Any chart with reliable volume data | Useful for confirming or challenging price moves | Volume data can be uneven in some forex feeds |
RSI and MACD are better at timing, but they need context, especially when price is trending hard.
OBV adds a useful reality check.
If price pushes higher while volume stays flat or fades, the move deserves suspicion.
The cleanest setup usually uses just two layers: one trend tool and one momentum tool.
Add volume only when your broker’s feed is reliable enough to make it meaningful.
Default settings still matter because the crowd watches them.
RSI 14 and MACD 12/26/9 remain common for a reason, but volatile markets often need faster reaction or stricter confirmation.
For a choppy session, some traders shorten moving averages or watch a faster RSI like 7 or 10 to catch swings earlier.
Others keep the defaults and wait for price to prove itself, which is often the calmer choice during sharp news moves.
That balance is the real craft.
Clear charts beat crowded charts, especially when chart patterns in forex are already doing part of the talking.
Which setup deserves attention, and which one is just a pretty shape on a chart? In forex, the answer usually depends on where the pattern appears, how cleanly it forms, and whether price has already made a strong move.
Reversal patterns try to signal that a prior move is losing momentum and may be running out of buyers or sellers. Double tops, double bottoms, and head and shoulders often show up after a stretched move—when follow-through weakens and attempts to push price further start failing.
Continuation patterns are different. Flags, pennants, and triangles often act like a pause in the middle of a trend, where price compresses before resuming the previous direction. The key is context: the pause should happen after a real impulse, and the breakout needs confirmation (not just a first touch).
Reversal patterns worth respecting
A clean double top usually has two failed pushes into the same resistance zone, then a break lower. A double bottom works the other way around, with repeated failure to push price down. Head and shoulders is more telling when the right shoulder forms with weaker momentum than the left. That kind of fade often shows exhaustion before the break of the neckline.- Double top: Two highs near the same area, followed by weakness below support.
- Double bottom: Two lows near the same area, followed by a bounce through resistance.
- Head and shoulders: A higher middle peak, then weaker rallies on both sides.
Continuation patterns that keep the trend honest
Flags and pennants usually appear after a sharp impulse. If the move before them was weak, the pattern matters less.Triangles are a little trickier, because the market can break either way. The best ones form after a clear trend and then compress into a tighter range, showing tension building rather than random motion.
- Flag: A small sloping pause after a strong move.
- Pennant: A tiny symmetrical squeeze after momentum spikes.
- Triangle: Price coils between converging highs and lows.
Candlestick clues traders actually use
Pin bars, engulfing candles, and doji work best as confirmation, not solo signals. A pin bar with a long wick can show rejection. An engulfing candle can show sudden commitment. A doji can warn that the market is indecisive at that moment.Imagine EUR/USD pushing into resistance, printing a bearish engulfing candle, and then slipping below a recent swing low. That setup is far more interesting than the candle alone, because it gives context.
At that point, pattern recognition becomes less about guessing and more about reading pressure. That is where technical analysis forex starts to feel practical instead of decorative.
Building a repeatable forex trading strategy
Why do two traders see the same chart and get different results? Usually, one has a process, and the other has a collection of hopeful guesses.
A repeatable strategy starts with the same setup appearing under the same conditions.
That sounds obvious, but it is where many traders fall apart.
Forex.com defines a chart pattern as repeated price action, and OANDA describes chart patterns as a collective view of how market participants are behaving at that moment (Forex.com’s guide to 11 chart patterns and OANDA’s chart patterns guide).
At NairaFX, we see the same thing over and over: traders last longer when they narrow the game to a few decisions they can repeat.
Pick one higher timeframe, one execution timeframe, a small list of instruments, and one or two entry models.
Candlestick charts remain the most popular for that job because, as ForexTester’s 2026 chart patterns guide points out, the bodies and wicks show the fight inside each bar.
### Trading plan checklist
| Checklist item | Why it matters | Pass/Fail | Notes |
|---|---|---|---|
| Higher-timeframe trend confirms direction | Keeps trades aligned with the bigger move | Pass only if the higher chart agrees | D1 or H4 is enough for most plans |
| Setup matches defined pattern/indicator confluence | Prevents random entries | Pass only if every required signal appears | No “close enough” trades |
| Risk per trade within defined % of account | Protects the account during losing streaks | Pass only if the loss cap is set first | Many traders keep this small and fixed |
| Stop-loss and take-profit levels set | Removes hesitation after entry | Pass only if both are planned before the order | Never enter without an exit |
| Position size calculated | Keeps risk stable when stops change | Pass only if lot size fits the stop | Recalculate every trade |
| News calendar clear for trade duration | Avoids surprise volatility | Pass only if major releases are checked | Skip entries near high-impact events |
If a trade cannot pass every line, it does not belong in the live account.
That matters even more for NGN-funded accounts, where spreads, swaps, and conversion costs can eat a small edge fast.
Small costs are annoying; repeated costs are lethal.
Position sizing is just math dressed in trading clothes.
Use risk amount = account balance × risk %, then size the trade so the stop-loss equals that amount or less.
Imagine a trader with a NGN 500,000 account risking 1%.
The maximum planned loss is NGN 5,000.
If the stop is 40 pips, the lot size must be small enough that a 40-pip loss stays inside NGN 5,000.
That same logic works whether the setup is a trend continuation, a breakout, or a pullback entry.
The chart pattern is only useful when the risk stays fixed and the rules stay boring.
Repeatable forex trading techniques are not flashy.
They are the ones you can follow on a tired Tuesday and still trust on a wild Friday.
A clean setup can still blow up if the risk rules are sloppy.
That happens all the time in technical analysis forex: the chart looks neat, the entry makes sense, and then one news candle turns a good idea into an expensive lesson.
That is why stop placement, max drawdown limits, and risk per trade matter more than the pattern itself.
Chart setups are only “tradable” when the market’s trading conditions match your plan. Even if the pattern is correct, things like thin liquidity, sudden spread widening, and stop-hunting behavior can distort entries and exits—especially on fast candles.
Candlesticks still matter here because those wicks and bodies show the fight inside the move, which is exactly where stops get targeted and slippage creeps in.
News spikes demand a different tempo. Around policy headlines, inflation releases, or sudden market stress, the right move is usually to reduce position size first, then decide whether your stop still makes sense—rather than widening stops and hoping for the best.
- Stop placement: Put the stop where the trade idea is invalid, not where the pain feels tolerable.
- Risk per trade: Keep the loss small enough that one bad entry does not dent the week.
- Max drawdown cap: Set a hard line for the account, then slow down or stop when it is hit.
- Volatility adjustment: If the market gets jumpy, cut size before you even think about chasing price.
- Naira-pair quirks: USD/NGN and GBP/NGN can behave differently around local liquidity shifts, so wider spreads and thin fills deserve respect.
- Pattern patience: A breakout on a quiet pair is one thing; the same move on a stressed naira cross can be a trap.
A practical way to think about it is simple: less size, more patience, cleaner exits. At NairaFX, we treat naira crosses like a different animal, because they often are.
Common mistakes, biases and how to fix them
Overtrading usually starts with confidence, not panic.
A trader gets one decent win in technical analysis forex, then starts treating every small move like a setup.
That is where chasing signals and confirmation bias slip in and turn good chart patterns in forex into expensive noise.
False breakouts feed the habit.
Patterns are useful because they repeat often enough to matter, but they still reflect crowd behavior rather than certainty, as OANDA’s guide to chart patterns in technical analysis points out.
FOREX.com’s chart patterns guide makes the same practical point: the pattern matters less than the context around it.
A trading journal is the cleanest fix because it forces honesty.
Record timeframe, setup, entry, invalid level, and one sentence on why the trade existed before the click.
That makes it much harder to defend a random impulse as analysis.
Overtrading: Cap your trade ideas per session, not just your losses.
If the chart needs constant attention, the plan is probably too loose.
Chasing signals: Wait for the setup to close, then re-check the level after a brief pullback or retest.
A candle that looks exciting mid-flight often looks ordinary ten minutes later.
Confirmation bias: Write down the reason you would not take the trade.
That single habit exposes selective reading fast.
False breakout filter: Favor levels that matter on a higher timeframe, and ignore breakouts in thin, messy conditions.
ForexTester’s 2026 chart patterns guide is a useful reminder that pattern quality depends on structure, not just shape.
Journal review: Mark each trade as valid, late, forced, or missed.
After a week, the pattern in your behavior becomes obvious.
A decent journal does not just track profit.
It shows which forex trading techniques are disciplined and which ones are just emotional improvisation.
That is usually where the real edge starts.
Tools, platforms, and learning resources
Ever notice how one trader sees a clean setup and another sees noise? The difference is often not talent.
It is the toolkit.
A good charting platform, a reliable mobile app, and a few honest learning resources do something simple but powerful: they make technical analysis forex less messy.
Candlesticks still matter most because they show the fight inside each session, and pattern libraries help traders see that fight without guessing.
That matters even more for Nigerian traders.
Power cuts, mobile-first trading, and patchy internet all punish complicated setups, so the best tools are usually the ones that stay fast, clear, and usable on a phone.
Charting platforms that earn their keep
TradingView is the easiest place to start for clean charting, alerts, and quick pattern work.
MetaTrader 4 and MetaTrader 5 still matter because many brokers support them, and they are practical for order placement and basic analysis on the move.
For deeper pattern study, it helps to pair a live chart with a reference guide.
Forex Tester’s 2026 chart patterns guide and Forex.com’s chart pattern guide both frame patterns as repeated price behavior, not magic shapes.
- TradingView: Best for clean charts, watchlists, and alerts.
- MetaTrader 4/5: Useful when your broker support and execution matter more than bells and whistles.
- Mobile broker apps: Handy for checking positions fast, but weak for serious study.
- Pattern cheat sheets: Good for quick recall during screen time, not for blind trading.
Free resources and data that help
Free material is everywhere, but only a few resources are worth a trader’s attention.
OANDA’s guide to chart patterns is useful because it treats patterns as crowd behavior, which is how they actually work.
XS’s 2026 trading patterns cheat sheet is also handy when you need a fast refresher.
For broader technical groundwork, HYCM’s beginner guide to technical analysis keeps the basics simple.
Add an economic calendar, a broker’s spread page, and a note-taking app, and you have a solid low-cost setup.
> The best free resource is often a clean checklist, not another endless video.
Paper trading before live money
Paper trading makes sense when the setup is new, the platform is unfamiliar, or the trader still hesitates on exits.
Live trading makes sense only after the process works repeatedly under simulation and the rules feel boring in a good way.
A smooth transition usually looks like this: demo first, then tiny live size, then gradual scaling.
The goal is not to “feel ready.” The goal is to prove the method survives real clicks, real spreads, and real emotions.
When the tools are simple and the learning loop is tight, chart patterns in forex become easier to read and much harder to fake.
That is the kind of setup we like to build our own learning materials around at NairaFX.
The traders who last don’t trade every wiggle—they trade a repeatable process.
That’s why chart patterns in forex matter: they’re often the earliest readable sign that momentum is shifting, supply/demand is tightening, or a move is running out of room.
But the pattern is only half the job. The other half is execution discipline: a clear entry trigger, a defined stop placed at the point your idea is invalid, and enough patience to let the setup play out.
Try this: pick one pair today, mark five past examples of one pattern from the last month, and write down where your stop would have been and what would have invalidated the trade.
Small practice builds the habit that survives noisy markets.