

Most losing trades don’t come from bad luck; they come from misreading the rhythm of markets when a central bank report or jobs print lands. When a surprising economic indicator shifts expectations, currency pairs can reverse sharply within minutes, leaving unprepared traders nursing a position that suddenly looks foreign. Recognising which releases matter and how they move sentiment separates reactive noise-takers from consistent performers.
For Nigerian traders watching both naira crosses and major pairs, forex moves after data often follow predictable patterns — but those patterns depend on context, not just the headline. A stronger-than-expected inflation print will mean different positioning on a high-yield currency than on a safe-haven one, and trading strategies that ignore that nuance tend to get whipsawed.
This piece starts by showing how specific indicators change probability distributions for exchange rates, then looks at practical ways to fold those probabilities into entry, sizing, and stop decisions so that news becomes an edge rather than a stress point.
What Is an Economic Indicator?
An economic indicator is a measurable statistic that signals where an economy is headed, how fast it’s growing or contracting, and which sectors are leading or lagging. Traders use these data points as waypoints: some anticipate shifts, some confirm them, and others show what already happened. For forex traders, economic indicators are the raw inputs that move central-bank expectations, capital flows, and short-term volatility. Think of indicators as weather instruments for markets — a barometer for inflation, a thermometer for growth, and a wind vane for sentiment.
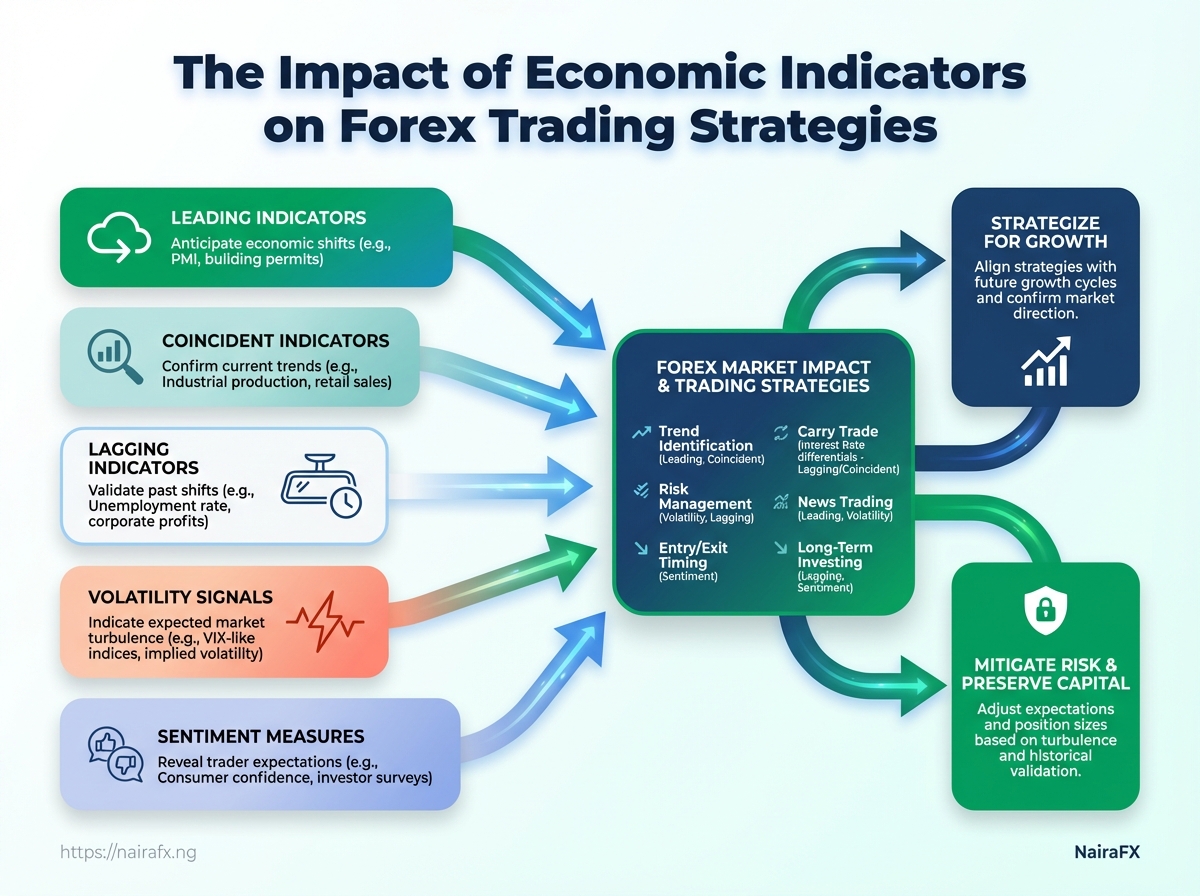
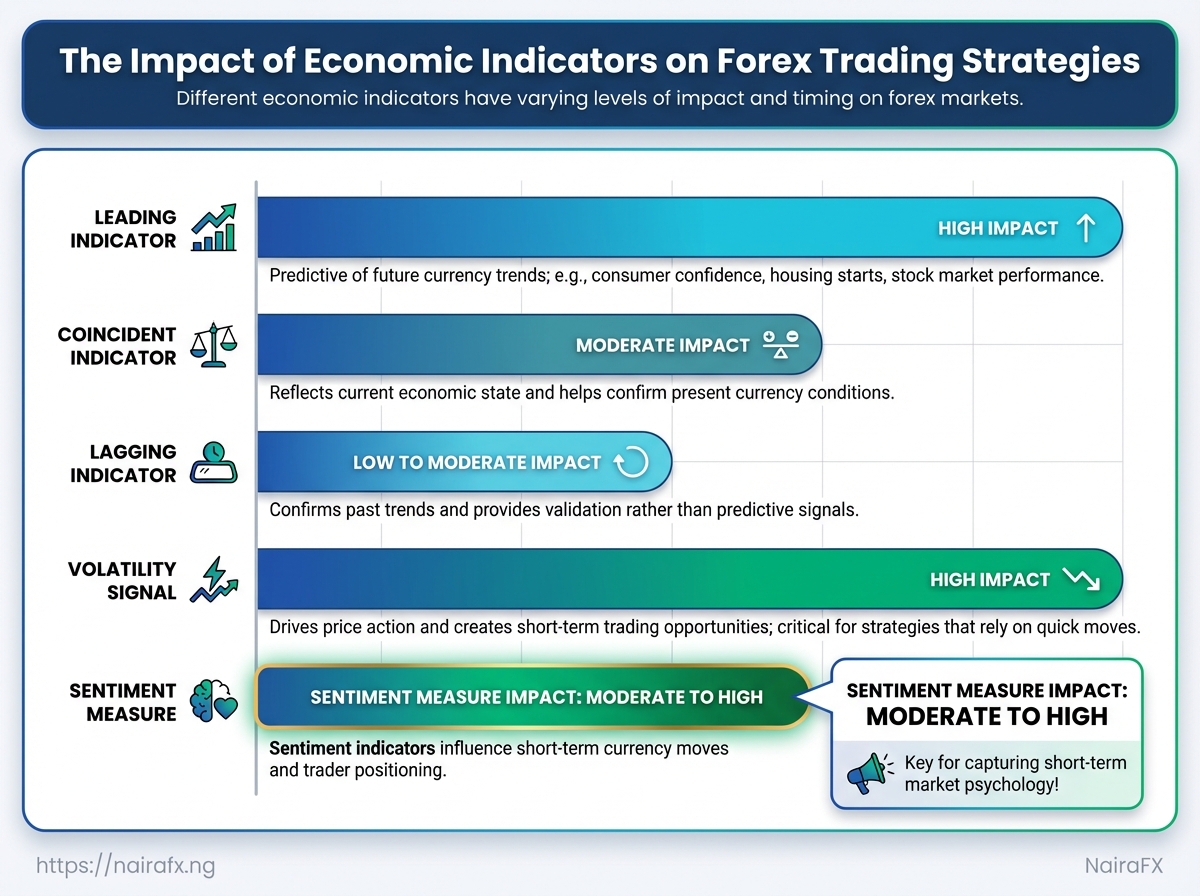
Economic indicators fall into clear timing categories that matter for trade setup and risk management. Leading indicators tend to change before the economy as a whole and can signal turning points. Coincident indicators move with the economy and validate ongoing trends. Lagging indicators confirm changes after they occur and help avoid false signals. Beyond timing, there are indicators that measure volatility (how choppy markets may become) and sentiment (how participants expect the future to look). Knowing which class an indicator belongs to affects whether it’s useful for initiating a position, sizing a trade, or adjusting stops.
Practical examples help: PMI releases often lead financial cycles, retail sales and industrial production move with current activity, and unemployment rate changes typically lag. In forex, an unexpected surprise in any of these can trigger sharp currency moves because they alter rate expectations and cross-border flows. Below are formal definitions and a compact comparison to map examples to market reactions.
Classification and definitions
Leading indicators: Signals that typically change before the broader economy does, useful for anticipating turning points.
Coincident indicators: Measures that move in line with overall economic activity, useful for confirming current trends.
Lagging indicators: Statistics that change after the economy has shifted, useful for validating trend persistence.
Volatility signals: Metrics or market measures (e.g., implied volatility) that indicate expected price swings.
Sentiment measures: Surveys and positioning data that reveal trader and consumer expectations.
Leading, coincident and lagging indicators with examples and typical market reactions
| Indicator Category | What it Measures | Common Examples | Typical Forex Market Impact |
|---|---|---|---|
| Leading | Future-oriented shifts in activity | PMI (manufacturing/services), building permits, new orders |
Can trigger anticipatory currency moves when surprise beats/ misses |
| Coincident | Current state of economy | Industrial production, retail sales, GDP (quarterly) | Confirms strength/weakness; sustained surprises shift trends |
| Lagging | Outcomes after shifts happen | Unemployment rate, corporate profits, consumer price index (some components) | Validates trend changes; smaller immediate currency impact |
| Volatility Signals | Expected or realized market turbulence | VIX-like indices, forex implied volatility, options skew | Higher readings increase risk premia and widen FX spreads |
| Sentiment Measures | Expectations and positioning | Consumer confidence, investor surveys, CFTC positioning | Extremes often precede reversals; positioning squeezes amplify moves |
Notice how the same release can play a different role depending on timing and context: a beat in a leading indicator can spark fresh momentum, while a similar beat in a lagging indicator mainly confirms what’s already priced in. Treat indicators as tools with distinct jobs — anticipation, confirmation, or risk assessment — and align them with trading timeframes and position sizing.
How Do Economic Indicators Affect Forex Markets?
Economic indicators move currencies because they change how traders expect central banks, companies, and investors will behave. When a release arrives, the market compares the actual number to what was priced in — that difference, the surprise, is the fuel for short-term moves. Big releases create concentrated order flow into a narrow time window, liquidity thins, and even modest surprises can trigger outsized price swings.
Mechanism: from data release to price movement
- Market participants form expectations through forecasts and positioning.
- The indicator is released and the headline number is compared with expectations.
- Algorithms and human traders submit orders based on the surprise and underlying components.
- Price moves as order flow hits available liquidity; stops and momentum traders amplify the move.
Common features that determine the magnitude of the move:
- Size of the surprise: larger deviations from consensus lead to larger immediate reactions.
- Liquidity at release time: thin liquidity (often outside major market hours) magnifies volatility.
- Breadth of relevance: indicators affecting growth and inflation shift currency expectations more than niche data.
- Headline vs components: a neutral headline can still hide meaningful directional signals inside the components.
Term: Surprise The difference between the released value and the market consensus estimate.
Term: Headline number: The top-line figure most headlines quote (e.g., nonfarm payrolls total employment).
Term: Underlying components: Subindices or revisions (e.g., part-time vs full-time jobs, private vs public payrolls) that can change the narrative.
Real examples traders watch closely include nonfarm payrolls, CPI, and central bank statements — because these directly affect interest-rate expectations. Practical behavior around releases often follows a pattern: pre-release tightening of spreads, a burst of volatility at the print, then a reassessment phase as deeper data and commentary filter in.
Using Monte Carlo simulation to test how strategies perform around releases helps quantify tail risk and refine position sizing. That kind of stress-testing is particularly valuable for traders dealing with Nigeria’s currency pairs and local market idiosyncrasies.
Watching expectations, reading beyond the headline, and managing position size around releases makes economic news tradable rather than terrifying.
Key Economic Indicators Traders Track
Traders watch a handful of economic releases more closely than anything else because they reliably move currency prices. Interest rate decisions and inflation set the longer-term direction and carry dynamics, while employment prints and PMI readings tend to spark sharp, near-term volatility. Knowing each indicator’s cadence, what it actually measures, and how markets typically react makes the difference between getting surprised and trading the reaction.
Interest Rate Decision: Central bank policy rate change or statement that shifts carry and yield expectations.
CPI / Inflation: Measures price changes across a basket of goods; core CPI strips volatile items and guides policy.
Nonfarm Payrolls / Employment: Headline jobs change and unemployment rate — a primary driver of immediate FX moves.
GDP: Broad measure of economic output; revisions matter almost as much as initial prints.
PMI (Manufacturing/Services): Survey-based activity gauges that lead short-term business cycle shifts and flash market volatility.
Quick-reference matrix of indicators showing frequency, what they measure, typical market impact, and volatility level
| Indicator | Frequency | Measures | Typical Forex Impact | Volatility (Low/Med/High) |
|---|---|---|---|---|
| Interest Rate Decision | Varies (monthly–quarterly) | Policy rate, forward guidance | Large directional moves; changes risk premium | High |
| CPI / Inflation | Monthly | Headline & core price changes | Alters rate expectations; strong moves in real yields | High |
| Nonfarm Payrolls / Employment | Monthly | Jobs added, unemployment, wages | Immediate spikes in FX volatility, especially USD pairs | High |
| GDP | Quarterly | Real economic growth rate | Re-prices long-term trends; revisions cause secondary moves | Med |
| PMI (Manufacturing/Services) | Monthly | Business activity, new orders, employment | Fast-moving for short-term trades, good for early trend signals | Med-High |
Market practitioners use these indicators differently depending on horizon and instrument. Short-term scalpers trade the headline vs. consensus and digest revisions; swing traders look for persistent shifts in rate expectations from CPI and central bank communications; position traders focus on multi-quarter GDP and policy paths to set carry and directional exposure.
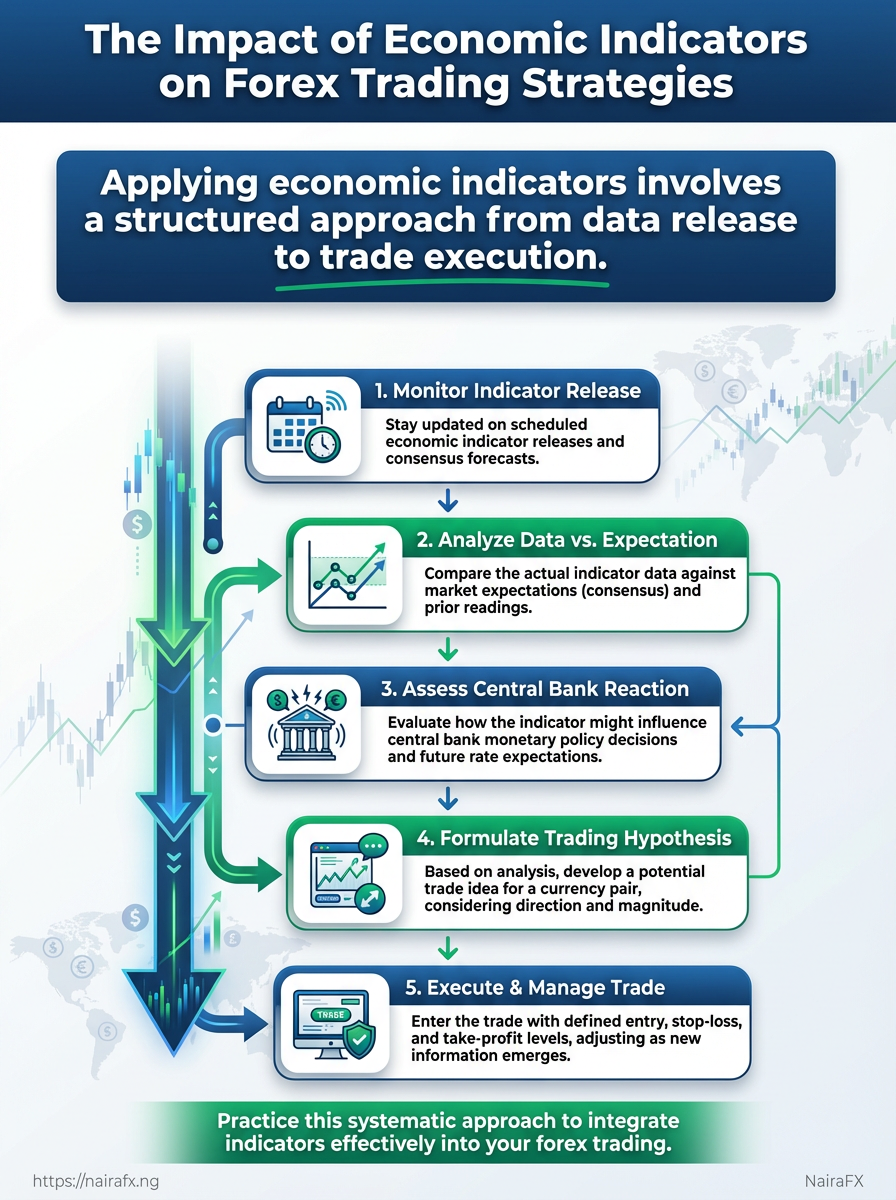
Practical approach to using releases: 1. Note the scheduled time and consensus number well before release. 2. Assess upside/downside surprise magnitude relative to expectations. 3. Trade the surprise, not the print: watch revisions, guidance, and market-implied rates.
A routine that combines a quick pre-release checklist with a plan for handling revisions turns raw data into actionable edges rather than noise. For Nigerian traders, this keeps volatility manageable while focusing capital where information asymmetry still exists.
📝 Test Your Knowledge
Take this quick quiz to reinforce what you’ve learned.
Incorporating Indicators into Trading Strategies
Start by treating indicators as signal lenses, not decision-makers. Indicators help filter and time trades when tied to concrete risk controls: position size, time-bound risk windows, and explicit entry/exit rules. Used correctly they increase conviction and consistency; used without discipline they create false confidence.
Why indicators should confirm, not replace price action
Indicators are derived from price and volume; they lag or smooth. That makes them useful for confirmation.
- Confirmation role: Use indicators to validate patterns you see on price charts.
- Avoid double-guessing: Don’t flip positions solely because an oscillator crosses a level—wait for price structure to agree.
- Multiple time-frame alignment: Favor signals where short-term indicators align with longer-term trend indicators.
Practical rules from simple to advanced
Position sizing: Size each trade so a single loss is a small, predefined percent of capital.
Scheduled risk window: Trade only during specific market hours or sessions when volatility and liquidity match your strategy.
Entry/Exit tied to indicator outcomes: Define exactly what an indicator crossing means for entry and where stop and target sit relative to price structure.
- Define an entry rule tied to indicator confirmation (example:
EMA(20)aboveEMA(50)plusRSI(14) > 50). - Define an initial stop using market structure (swing low/high) and a position size that limits risk to X% of equity.
- Define a trailing rule or profit target (example: exit when
RSI(14) < 60and price closes below the 20 EMA). - Backtest the full rule set over at least 500-1,000 ticks or days depending on timeframe.
Advanced setups and testing
For multi-indicator systems, keep the rulebook strict: one indicator for trend, one for momentum, and one for volatility. Example stack:
- Trend:
EMA(50)direction. - Momentum:
RSI(14)thresholds. - Volatility:
ATR(14)for stop sizing.
Monte Carlo simulation is useful to stress-test how indicator-driven entries perform across sequences of wins and losses. NairaFX’s Monte Carlo service can quantify expected drawdowns from a given rule set, making it easier to decide position sizing and acceptable run-length risk.
Using indicators this way converts opinions into repeatable rules that can be tested and traded with discipline. Stick to rules that preserve capital first; the profits follow.
Common Misconceptions About Indicators and Forex Trading
Indicators are tools, not gospel. Traders often treat them like traffic lights that tell you exactly when to go or stop — when what they actually provide is contextual information about price behaviour, momentum, and liquidity. Expecting a single oscillator or moving average to predict direction reliably misunderstands how markets work and sets you up for inconsistent results.
Markets are driven by order flow, liquidity, and participants with differing time horizons. That means:
- Indicators lag: Many indicators are calculated from past prices; they describe what happened, not what will happen.
- Context matters: The same RSI reading behaves differently on a trending GBP/USD than on a choppy Naira pair.
- Risk controls decide outcomes: A perfect signal with poor position sizing still destroys an account.
Contrast common myths vs. reality and practical countermeasures for traders
| Misconception | Why it's wrong | Reality | Practical Fix |
|---|---|---|---|
| Indicators always predict direction | Most indicators are derived from past price; they lag and produce false signals | Indicators indicate probability and market condition, not certainties | Combine indicators with price action and liquidity checks; confirm across timeframes |
| News trading is only for pros | News creates rapid price moves but accessibility and prep matter more than status | News trading is accessible with a tested playbook and risk limits | Use economic calendar alerts, avoid overleveraging, and trade smaller during releases |
| High volatility equals higher profits | Volatility increases opportunity but also slippage, spread widening, and false signals | Higher volatility raises both reward and execution risk | Tighten risk controls, use limit entries, and expect wider stops |
| All currency pairs react the same | Different pairs have distinct liquidity, drivers, and institutional participation | Each pair has its own personality and typical ranges | Backtest strategies per pair; adjust stops and targets to pair-specific behaviour |
| Technical signals are irrelevant during news | Some technicals fail in news, but others (like levels of liquidity) remain useful | Technical context still helps interpret post-news order flow | Wait for candles to close post-release; trade retests of structural levels rather than initial spikes |
Key insight: The table shows that indicators become useful when paired with context, execution discipline, and an understanding of liquidity rather than treated as standalone predictors.
Practical examples help: pair a moving average crossover with a daily structure break and confirm with volume profile before risking capital. Small changes like adjusting stop distance per pair or stepping out of the market on known illiquid hours improve long-term edge. Trust tools, not promises — that mindset keeps trading realistic and sustainable.
Real-World Examples and Case Studies
Three annotated trade scenarios show how preparation, choice between immediate reaction and waiting for follow-through, and regional economic indicators change outcomes. Each case is presented with the setup, the execution decision, the result, and the practical lesson—so these aren’t theory, they’re play-by-play trading decisions.
Scenario 1 — Pre-release hedged position (short-term forex reaction) A major Nigerian PMI print was due while the naira showed intraday weakness. The trader prepared with a pre-release plan: reduced position size and placed a stop-loss sized to historical intraday volatility.
- Setup: Small hedge entered using forwards to protect open long exposure.
- Trigger: PMI missed expectations.
- Execution: Rather than instant panic-sell, the trader tightened stops and waited 10 minutes to see order flow.
- Outcome: Initial spike reversed as liquidity providers filled the gap; hedged position limited drawdown to 0.6%.
- Lesson: Preparation before releases prevents emotional sizing and preserves capital.
Scenario 2 — Immediate reaction vs follow-through (momentum play in EUR/USD) A European inflation surprise created a sharp move. Two approaches were tested in parallel by different traders.
- Trader A acted immediately and took the first momentum candle with a tight
take-profit. - Trader B waited for follow-through and confirmation on a 15-minute close above the high.
Trader A booked a quick 25 pip gain but was stopped out the next day when the move faded. Trader B entered later, rode the sustained trend for 60 pips.
- Observation: Immediate reaction wins when liquidity and tight execution are certain; waiting for follow-through reduces false-break risk.
- Practical rule: Choose the style that matches your execution edge and risk budget.
Scenario 3 — Correlated opportunities from regional indicators (FX pairs and equities) A surprise interest-rate tweak in a West African neighbour pushed both regional currencies and local equities in the same direction. Traders who scanned correlated instruments found cheaper entries.
- Opportunity: Short-term weakness in local bond yields offered a cheaper hedge than FX forwards.
- Outcome: Combined FX and bond positioning increased risk-adjusted return.
- Why it mattered: Regional indicators often move asset clusters together—scan equities, bonds, and FX simultaneously.
Follow-through: Entering after a confirmatory close reduces false signals and aligns positions with institutional flow.
Pre-release plan: Reduce size, set stop-loss, and define re-entry rules.
Practical note: run a Monte Carlo simulation on these trade patterns to see distributional outcomes before scaling live positions. Real cases like these show how planning and reading correlated signals change real-world results—apply them and tune to your execution capacity.
📥 Download: Forex Trading Strategies Checklist Based on Economic Indicators (PDF)
Practical Checklist and Next Steps for Traders
Start by turning analysis into a repeatable routine: set the calendar, form a consensus view, write a clear plan, size positions, execute with discipline, and review with evidence. That simple cycle—calendar → consensus → plan → size → execute → review—keeps emotions out of decisions and creates a reliable feedback loop for improvement.
1. Calendar: Mark major economic events and asset-specific news on a shared calendar at least one week ahead.
2. Consensus: Collect market bias from three sources (economic calendar, broker news feeds, price action). Agree on the expected direction and acceptable scenarios.
3. Plan: Define entry criteria, stop-loss, take-profit levels, and contingency rules for news spikes. Keep the plan under 100 words.
4. Size: Use a position-sizing rule tied to portfolio risk (for example, risk 0.5–1% of equity per trade using risk-per-trade calculations).
5. Execute: Enter only when the plan’s conditions are met; avoid discretionary overrides unless a documented rule permits it.
6. Review: Log every trade with screenshots, rationale, and emotions at the time. Run weekly micro-reviews and monthly statistical reviews (win rate, average R, drawdowns).
Quick operational habits to adopt: Daily start: Review the economic calendar and overnight price moves before the market opens. Midday check: Confirm trade management rules around major releases. * End-of-day: Update the trade journal and tag trades by setup type.
Recommended tools and resources with purpose, cost (free/paid), and quick usage tips
| Tool/Resource | Purpose | Cost | Quick Tip |
|---|---|---|---|
| Bloomberg Economic Calendar | Macro release timings and impact | Paid (Bloomberg Terminal) | Focus on high-impact flags for NGN-sensitive pairs |
| Investing.com Economic Calendar | Global event schedule | Free (ads) | Filter by importance and region to avoid noise |
| TradingEconomics | Historical macro data and charts | Paid/Free tiers | Use historical replay for scenario building |
| S&P Global PMI (IHS Markit) | PMI releases for manufacturing/services | Paid | PMI shifts often lead FX directional moves |
| TradingView (Volatility indicators & charts) | Price action, indicators, alerts | Free / Pro from $14.95/mo | Set alerts on ATR breakouts and trendline flips |
| Broker News Feed (e.g., IG, Saxo) | Market commentary and instant alerts | Free with account | Use for trade idea cross-checks, not execution justification |
| Volatility Scanner (TradingView Screener) | Scan currency pairs by volatility | Free / Pro | Sort by ATR% to spot sudden movers |
| Trade Journal (Google Sheets template) | Record trades, screenshots, P&L | Free | Keep columns for setup, rule followed (Y/N), and emotion |
| Edgewonk / TraderSync | Advanced journaling and analytics | Paid ($/yr) | Use to calculate expectancy and edge per setup |
Key insight: The tools above cover timing (economic calendars), signal confirmation (volatility scanners, broker feeds), and accountability (trade journals). Combining free and paid options gives redundancy without overpaying—use paid services where they give unique analytics you can’t replicate in a spreadsheet.
Start small, apply the checklist to a handful of trades, and let the journal drive refinements. Over time that disciplined loop turns occasional wins into a scalable edge.
Conclusion
Markets move on information, and the sensible trader treats economic indicators as the tempo rather than a gospel. You learned which indicators matter most for currency pairs, how expectations versus actual prints can flip positions in minutes, and why layering indicators into a coherent trading plan beats chasing single releases. Remember the case where a surprise jobs print reversed a short USD position within an hour — that’s the practical cost of ignoring context (trend, liquidity, central bank guidance). If you’re asking “which indicator should I watch?” or “when is a headline worth trading?”, focus on the indicators that align with your time frame and always weigh the market’s expectation against the surprise element.
Next actions: focus your calendar on the 2–3 indicators that match your strategy, practice trade management around high-impact releases, and review past reactions to build rules, not feelings. Quick checklist for the next week: - Track upcoming reports and their market-implied expectations. - Backtest one indicator combo for at least 30 events. - Use a live demo or low-risk size to observe real-time reactions.
To streamline execution and access timely forex news trading tools, consider a platform like NairaFX for market data and order routing. Take these steps, refine your rules from real examples, and the next surprising print will be an opportunity, not a panic.