

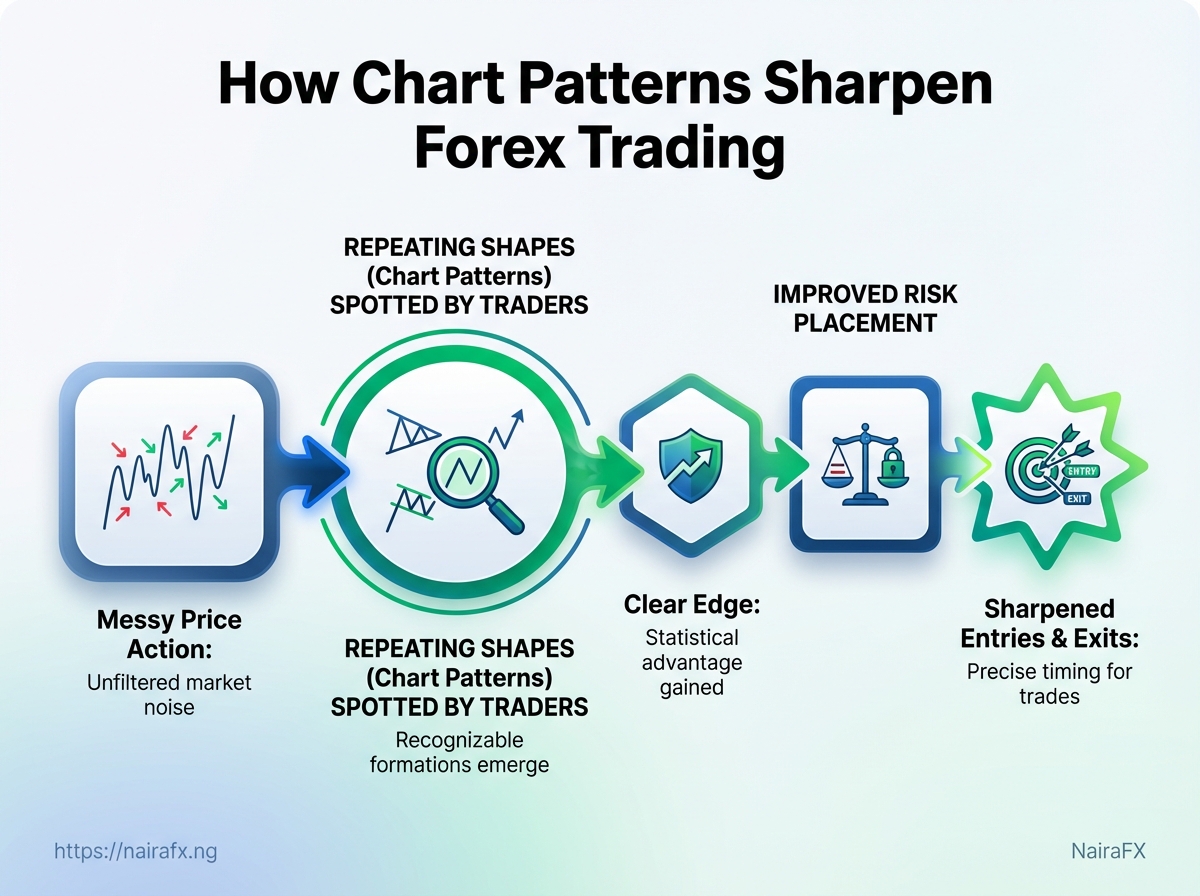
Price action appears chaotic when the Naira changes and liquidity decreases. However, the same patterns keep appearing on charts. Traders who spot a chart pattern before others have a clear advantage. They can avoid guessing with each price spike.
By recognizing common forex trading patterns, traders can respond more quickly and manage risks effectively. This is true whether they are scalping during London hours or holding positions during an economic release. These ten patterns reliably signal where momentum may go next. Learning them can improve how traders enter and exit positions.
Key Takeaway: This section offers a quick review of the key chart formations for active traders. Each entry explains how to identify… This section offers a quick review of the key chart formations for active traders.
Top 10 Chart Patterns
This section offers a quick review of the key chart formations for active traders. Each entry explains how to identify…
Top 10 Chart Patterns
This section offers a quick review of the key chart formations for active traders. Each entry explains how to spot the pattern, where to set your entry, stop, and target, and why it typically works in real markets.
1. Head and Shoulders
This pattern is a bearish reversal with three peaks: a left shoulder, a higher head, and a right shoulder. The neckline connects the two lows. Enter when the price breaks and retests the neckline with strong volume. Stop: Above the nearest shoulder.Target: Measured move from head to neckline projected down. Why it works: It captures a shift from buyers making higher highs to sellers asserting control, and the retest reduces false-break risk.
2. Inverse Head and Shoulders
Bullish mirror of the head-and-shoulders forming at downtrend lows. Entry: Neckline breakout confirmed by rising volume. Stop: Below the right shoulder or the head for conservative risk control.Target: Measured move from head to neckline projected up. Why it works: Shows exhaustion of sellers and institutional buying at a clear support area.
3. Double Top
Two failed breakout attempts forming twin peaks followed by a break of the intervening support. Entry: Break of the support (neckline) with momentum indicators confirming. Stop: Above the second peak.Why it works: Repeated rejection at resistance signals distribution; RSI or MACD can flag weakening momentum.
4. Double Bottom
Two similar lows that create a base and a bullish reversal on breakout. Entry: Breakout and retest of the neckline. Stop: Below the second bottom.Target: Measured move from valley to neckline. Why it works: Demonstrates demand at a price level after sellers fail to push lower.
5. Ascending and Descending Triangles
One flat line meets a sloping trendline — flat side shows persistent supply/demand. Entry: Trade the breakout direction; use volume for confirmation. Stop: Inside the triangle, near the breakout point.Why it works: Flat line indicates a level market participants respect; slope points to compression and likely breakout bias (ascending favors upside, descending favors downside).
6. Symmetrical Triangle (Continuation Pattern)
Converging trendlines during consolidation; breakout often follows prior trend. Entry: Confirmed breakout with retest. Stop: Inside the triangle near breakout.Target: Triangle base width projected from breakout. Why it works: Reflects market compression and indecision before continuation.
7. Flags and Pennants
Short, tight consolidations after strong moves (the flagpole). Entry: Breakout in the direction of the prior trend with volume spike. Stop: Below/above the flag or pennant extreme.Target: Measured by the preceding flagpole. Why it works: Represents a pause for breath before trend resumes; high-probability on strong momentum.
8. Wedges (Rising and Falling)
Converging lines sloping up (rising wedge) or down (falling wedge); typically exhaustion signals. Entry: Confirmed break and retest in expected reversal direction. Stop: Outside the wedge extreme.Why it works: Price squeezes into a narrowing range while momentum diverges, hinting at a reversal.
9. Cup and Handle
A rounded cup followed by a shallow handle; classic bullish continuation/reversal. Entry: Breakout above handle on increased volume. Stop: Below handle low.Target: Cup depth projected upward. Why it works: Combines a long consolidation (cup) with a short shakeout (handle) before buyers resume control.
10. Rounding Bottom (Saucer)
A long, gentle bottom that signals gradual accumulation on daily/weekly timeframes. Entry: Breakout above the rim with trend confirmation or on a solid retest. Stop: Below recent consolidation lows.Target: Based on the depth of the saucer and trend context. Why it works: Reflects a change in market psychology from slow selling to steady buying over time.
These patterns form a shared language for reading supply and demand on charts. Combine them with volume, RSI/MACD, and sensible risk placement to make them reliable tools rather than guesswork.
Key Takeaway: The table below summarizes key trading criteria for the ten most commonly used forex chart patterns. … The table below summarizes key trading criteria for the ten most commonly used forex chart patterns.
Comparison Table: Quick Reference
The table below summarizes key trading criteria for the ten most commonly used forex chart patterns.…
Comparison Table: Quick Reference
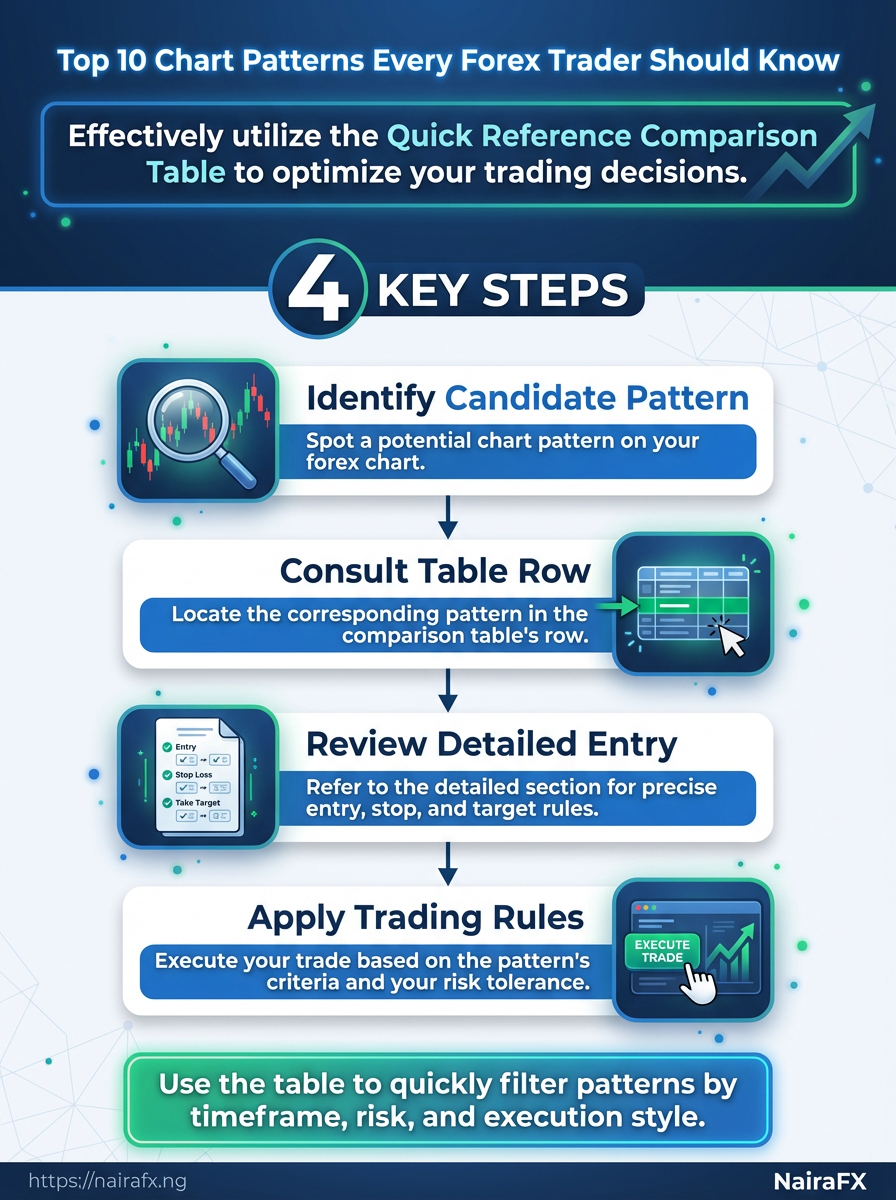
The table below summarizes key trading criteria for the ten most commonly used forex chart patterns. This helps traders choose a pattern that matches their timeframe, risk tolerance, and execution style. Read the row for a candidate pattern, then follow the detailed item for precise entry and management rules.
Side-by-side comparison of all 10 patterns on consistent trading criteria for quick selection
Table: Comparison Table: Quick Reference — Pattern, Type (reversal/continuation), Typical Timeframes & more
| Pattern | Type (reversal/continuation) | Typical Timeframes | Entry Signal | Stop Placement | Target Method | Reliability |
|---|---|---|---|---|---|---|
| Head and Shoulders | Reversal | 4H–Daily | Break of neckline with increased volume | Above right shoulder | Measured move = head to neckline | Medium–High |
| Inverse Head and Shoulders | Reversal | 4H–Daily | Break of neckline + retest | Below right shoulder | Measured move = head to neckline | Medium–High |
| Double Top | Reversal | 1H–Daily | Close below neckline after second peak | Above higher peak | Measured move = peak-to-neckline | Medium |
| Double Bottom | Reversal | 1H–Daily | Close above neckline after second trough | Below lower trough | Measured move = trough-to-neckline | Medium |
| Ascending Triangle | Continuation (bullish) | 1H–Daily | Break above flat resistance on volume | Below recent swing low | Height of base added to breakout | Medium–High |
| Descending Triangle | Continuation (bearish) | 1H–Daily | Break below flat support | Above recent swing high | Height of base subtracted from breakout | Medium |
| Symmetrical Triangle | Continuation/neutral | 15m–Daily | Breakout direction confirmed by volume | Opposite side swing high/low | Projected move = max width at base | Variable (depends on breakout) |
| Flags / Pennants | Continuation | 15m–4H | Breakout in trend direction with momentum | Below flag/pennant structure | Measured by flagpole length | High (in trending markets) |
| Wedges (Rising/Falling) | Reversal/continuation | 1H–Daily | Breakout opposite slope (rising wedge bearish) | Above/below wedge extreme | Measured move = wedge height | Medium |
| Cup and Handle | Continuation (bullish) | 4H–Daily | Break above handle resistance on volume | Below handle low | Measured move = cup depth | Medium–High |
Follow the row you select, then consult the detailed pattern entry rules for exact confirmation signals, volume filters, and position-sizing examples—those nuances materially affect outcomes in real forex markets.
How to Trade Patterns: Rules, Risk, and Confirmation
Trading a pattern without careful confirmation…
How to Trade Patterns: Rules, Risk, and Confirmation
Trading a pattern without careful confirmation and sizing feels like navigating without a compass. Treat patterns as guesses that require filters, a clear context, and a defined exit before risking your money.
Confirmation
To confirm the pattern, look for signs that the market supports it. Volume spikes on a breakout, momentum alignment, or a higher-timeframe structure flip are practical confirmations.
To confirm a pattern, consider these signs:
- Volume spike: Breakout candle with volume above recent average supports follow-through.
- Momentum confirmation:
RSImoving away from neutral levels orMACDcrossing in the direction of the breakout reduces whipsaws. - Higher timeframe alignment: If daily structure is bullish, prefer long breakouts on the 1H or 4H charts.
Filters
Apply filters to reject low-probability setups before entering a trade.
- Avoid breakouts into obvious congestion or against a clear higher-timeframe trend.
- Require a retest of the breakout level for larger patterns to improve odds.
- Use divergence (price-new-high vs momentum-lower-high) to reject false breakouts.
- Identify the pattern on your trading timeframe.
- Check higher-timeframe structure for directional bias.
- Confirm breakout with one or more filters (volume, momentum, retest).
- Only then calculate size and place the trade.
Risk Management
Risk per trade: Decide a fixed percentage of account equity to risk—Research from IG suggests that common ranges are typically around 0.5–2%.
Stop placement: Use volatility-aware stops. For example, According to forex.com, set the stop at entry - 1.5 × ATR(14) for longs, or use the pattern width (distance from breakout to pattern extreme) plus a small buffer.
Position sizing
Position sizing formula: position_size = (account_equity × risk_pct) / stop_distance_in_currency
- Example: Account ₦500,000, risk 1% → ₦5,000 risk. If stop distance is ₦50 per lot, size = 100 lots.
- When using pattern width: measure width, add buffer, convert to currency for the formula.
Risk:Reward
Risk:Reward: Aim for at least 1:1.5–1:2 on reliable patterns. Smaller mismatches only make sense with very high win-rate edges.
Warnings on common mistakes: risking arbitrary lot sizes, ignoring volatility, or entering without higher-timeframe alignment leads to blown stops and poor expectancy. Apply these rules consistently and patterns stop being guesses and start becoming repeatable trades. Trade selection plus disciplined sizing protect capital and compound edge over time.

Key Takeaway: These chart patterns and related techniques are important to know, even if they are not in most strategy guides. Each entry includes a brief description, a practical use case, and the reason it is noteworthy for forex traders.
Honorable Mentions
These chart patterns and related techniques are important to know, even if they are not in most strategy guides. Each entry includes a brief description, a practical use case, and the reason it is noteworthy for forex traders.
1. Broken-clock Reversal
A slow-building reversal where price repeatedly tests a level before snapping back; looks like a stretched double-top or double-bottom. Use case: Useful on higher timeframes to filter impatient entries after extended consolidation. Why it matters: Less common, so when it resolves it often signals institutional interest.2. Micro-Range Compression
Very tight price action over several bars indicating compressed volatility prior to a directional move. Use case: Day traders use it to setstop-entry orders for breakout scalps. Why it matters: High reward-to-risk for quick moves, but false-break risk is elevated.
3. Sequential Momentum Shift
A sequence of lower highs (or higher lows) across multiple timeframes that precedes trend continuation. Use case: Position traders combine this with weekly bias to add to winning trades. Why it matters: Subtle and easy to miss, so it’s an edge when incorporated into multi-timeframe checks.4. Measure-of-Mean Reversion
Pattern that uses recent mean and standard deviation bands to identify short-term pullback targets. Use case: Swing traders hunting re-entries into a clear trend. Why it matters: Quantifies reversion potential instead of relying on subjective support lines.5. Volume-Price Discrepancy
Price makes a new high/low but volume fails to confirm, indicating weakening participation. Use case: Exit signal or cue to tighten stops in trending positions. Why it matters: Volume is underused in forex; divergence can preempt big reversals.6. Fractal Ladder
Repeated small fractal patterns aligned in the trend direction, stacking to signal momentum strength. Use case: Used to pyramid positions with defined scaling rules. Why it matters: Provides disciplined entries without overfitting single-bar setups.7. Liquidity Pool Sweep
Brief spike beyond obvious stops followed by rapid reversal when those stops are filled. Use case: Short-term contrarian entries after institutional stop runs. Why it matters: Risky but explains many sudden wick moves common in volatile Naira pairs.8. Monte Carlo Pattern Validation
Using simulation to test pattern robustness across randomised market paths rather than single historical runs. Use case: Validates whether a pattern’s edge survives slippage and varying market regimes. Why it matters: Adds statistical confidence—this is where Monte Carlo services shine for strategy builders.These lesser-known patterns sharpen trade selection without adding noise. Pick a couple that fit your timeframes, test them with realistic sizing, and they become practical tools for cleaner entries and exits.
Conclusion
Identifying patterns, whether a clear head-and-shoulders that signals a sell-off or a double-bottom that indicates a quick rebound, transforms confusing price action into useful signals. Remember the key rules: pair the pattern with confirmation, manage your risk wisely, and stay aware of liquidity changes in the Naira. Many traders believe that those three habits—pattern recognition, confirmation, and disciplined risk—can help separate a hopeful guess from repeatable results in chart patterns in forex.
Put this into practice with a short plan: start scanning daily charts for the top patterns, paper-trade entries using confirmation and clear stop-losses, and review trades weekly to refine your rules. For step-by-step drills and templates, see the NairaFX trading guides. If the next question is “how do I confirm a breakout?” look first for a retest plus increased volume; if it’s “how much to risk?” stick to a small fixed percentage per trade.