

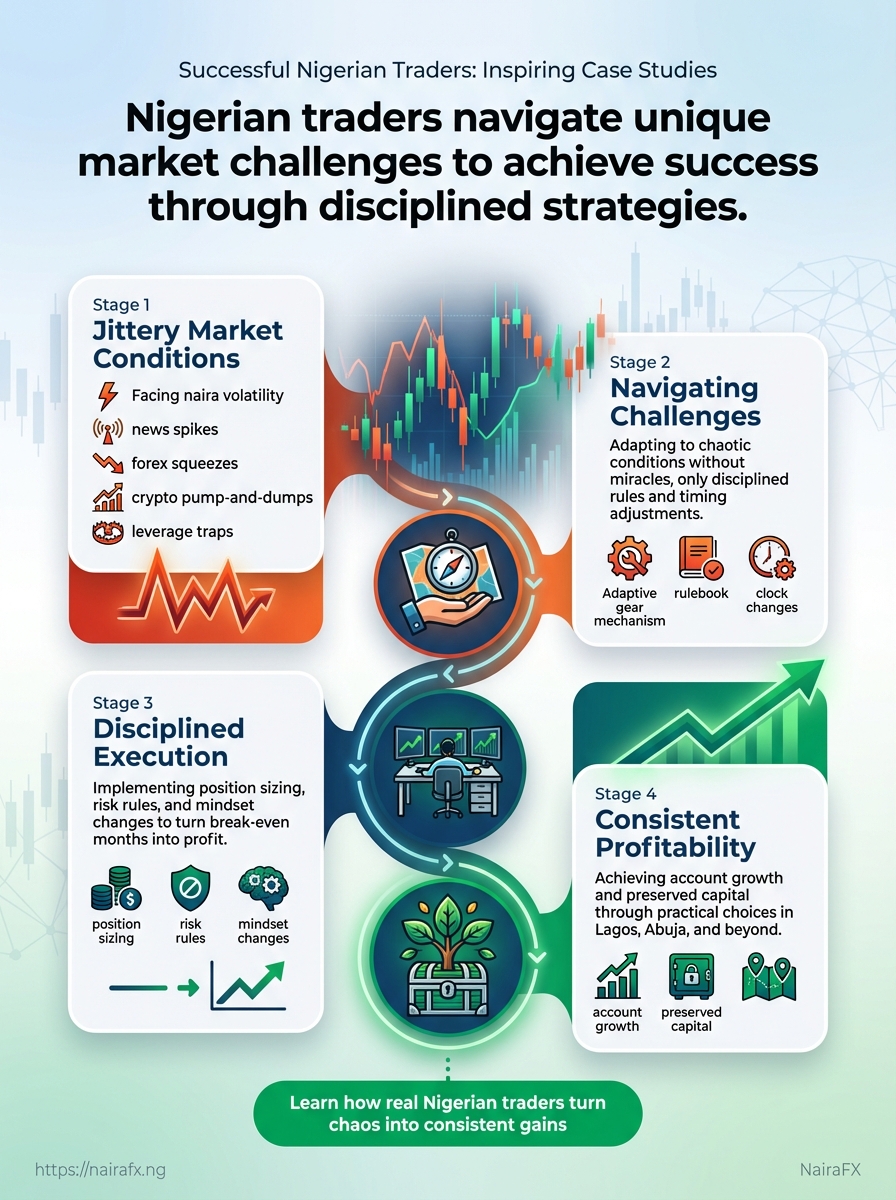
You know the jitter of staring at candle charts while naira volatility spikes and news headlines shift the market within minutes. That pressure separates talkers from traders who actually make repeatable gains, and these pages focus on real-world examples of Nigerian trader success stories that began in the same chaotic conditions many readers face.
These case studies trace how individual traders navigated forex squeezes, crypto pump-and-dumps, and leverage traps without miracles—only disciplined rules, position sizing, and timing adjustments that worked in Nigerian market realities. Each story highlights a specific turning point: a missed signal turned into a strategy tweak, a risk rule that stopped a drawdown, a mindset change that turned break-even months into consistent profit weeks.
Expect concrete scenes, not platitudes: trades opened and closed, mistakes owned, adjustments logged, and outcomes measured in account growth and preserved capital. The aim is simple—show what practical choices made success possible for traders operating from Lagos, Abuja, and beyond, so similar decisions can be tested and adapted in your own trading.
Why Nigerian Trader Case Studies Matter
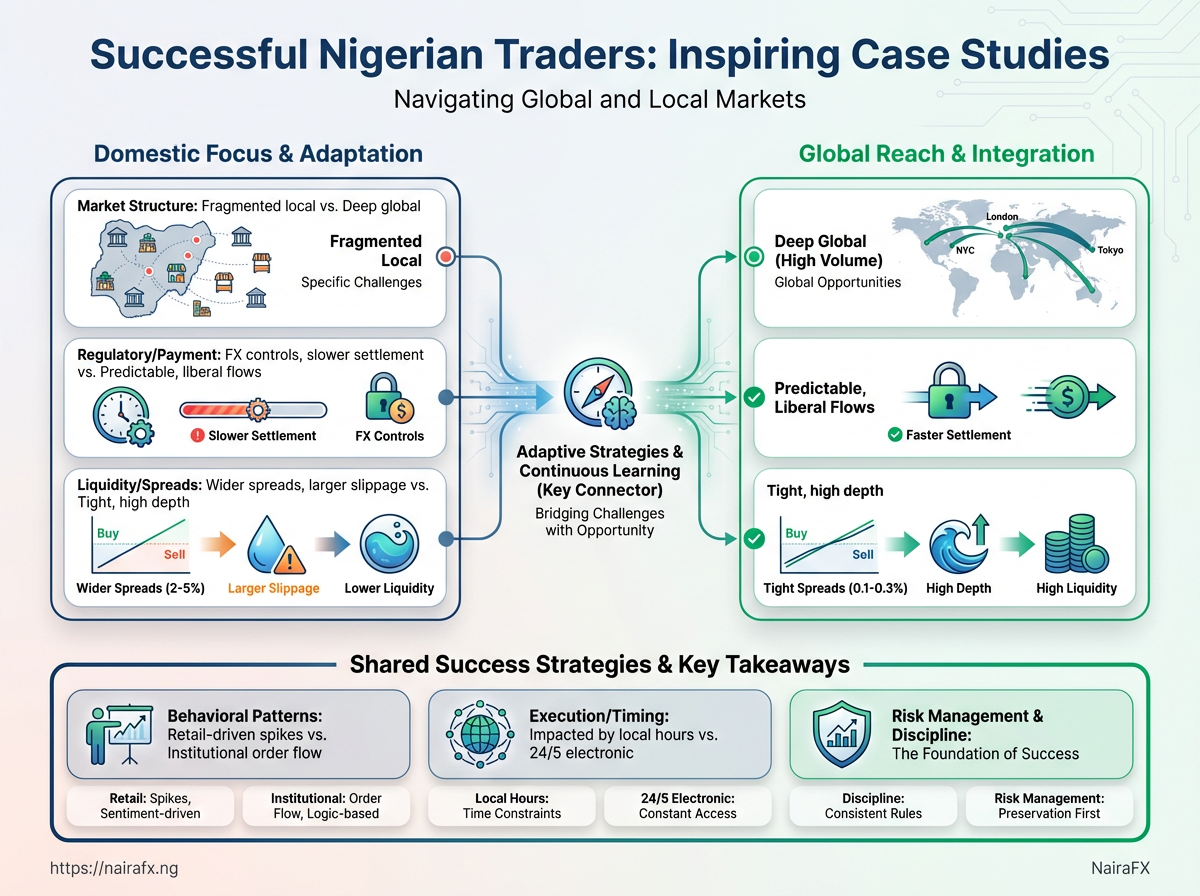
Local success stories matter because execution and risk live in the small details that global case studies often miss. Traders who succeed in Nigeria navigate a mix of currency controls, fragmented liquidity, payment frictions and intense retail-driven volatility — factors that change how a strategy performs even when the chart patterns look identical. Studying peers who traded and adapted inside that environment reveals practical adjustments: when to widen stop-losses, which broker routing to prefer, how to hedge naira funding risk, and which intraday windows are reliably tradable.
Practical lessons from Nigerian traders are actionable in ways theoretical papers are not. They show how to translate a robust backtest into a working process under Naira funding, local bank settlement times, and OTC quote behavior.
- Context matters: Same strategy backtested on an ECN feed can fail when execution suffers from wide local spreads.
- Behavioral signals: Nigerian retail flows create recurring intraday imbalances that can be anticipated once identified.
- Operational fixes: Simple operational changes — like batching withdrawals, routing through a particular payment channel, or choosing specific trading hours — materially reduce slippage and emotional drawdown.
Side-by-side comparison of generic global case studies vs Nigeria-specific case studies highlighting differences in applicability
| Aspect | Global Case Studies | Nigeria Case Studies | Actionable Takeaway |
|---|---|---|---|
| Market structure | Deep, multi-venue FX/crypto markets with ECN/MTF access | Fragmented local market; onshore FX split between official windows and parallel market | Adapt execution plans to fragmented liquidity; test on local feeds, not only aggregated global data |
| Regulatory/payment constraints | Mature rails, predictable settlement, liberal capital flows | FX controls, Naira repatriation limits, slower bank settlement windows | Build cashflow and funding rules into risk models; plan for delayed settlements |
| Liquidity and spreads | Tight spreads on major pairs, high depth during market hours | Wider spreads, larger slippage during thin local hours | Use wider, dynamic spread assumptions in sizing and stop placement |
| Behavioral patterns | Institutional order flow dominates; macro drivers are primary | Retail-driven momentum spikes, herd exits around news and payments cycles | Monitor local retail sentiment indicators and payment-cycle calendars |
| Execution/timing | 24/5 electronic execution, predictable latency | Execution impacted by bank hours, weekends, and local holidays | Schedule heavy executions during overlapping global/local liquidity windows |
Studying Nigerian trader success stories shortens the learning curve: they surface the small, repeatable adaptations that protect capital and preserve edge in a market that looks familiar but behaves differently. Applying those lessons makes strategies resilient, not just theoretically profitable.
Client/Trader Background Profiles
Different trading styles demand different starting points, constraints and tools — and Nigerian market realities reshape those needs. Below are compact, scannable archetypes that reflect real intake-forms and interviews with Nigerian traders. Each profile gives a practical starting capital range, typical instruments, experience level and the single most common constraint that slows progress in this market.
Structured overview of all trader profiles for quick comparison
| Trader | Starting Capital (USD/NGN) | Primary Instruments | Experience (years) | Primary Constraint |
|---|---|---|---|---|
| Trader A – Swing Forex | $1,000–$5,000 (≈₦750k–₦3.75M approx.) | Major currency pairs, regional FX crosses | 1–4 | Limited access to reliable USD liquidity for funding |
| Trader B – Crypto Day Trader | $300–$2,000 (≈₦225k–₦1.5M approx.) | BTC, ETH, altcoin spot & perpetuals | 0.5–3 | Payment onramps and KYC delays with local exchanges |
| Trader C – Long-term Position Trader | $5,000–$50,000 (≈₦3.75M–₦37.5M approx.) | FX, equities, ETFs, occasional commodities | 3–10+ | Portfolio allocation affected by FX conversion and repatriation rules |
| Trader D – Algorithmic Retail | $2,000–$20,000 (≈₦1.5M–₦15M approx.) | FX, crypto, backtested strategies, VPS-hosted bots | 1–6 | Reliable VPS/infrastructure and brokerage API access |
| Trader E – Prop-funded Nigerian | $0 (evaluation capital)–$10,000 (≈₦0–₦7.5M approx.) | Futures, FX, equities under prop rules | 1–5 | Capital scaling tied to strict drawdown and payout rules |
- Trader A – Swing Forex: Typically uses multi-day setups and
equity curvesmoothing; success depends on executing position sizing and accessing stable USD funding. - Trader B – Crypto Day Trader: Operates on tight intraday spreads; faces friction from delayed NGN-USD conversions and exchange withdrawal limits.
- Trader C – Long-term Position Trader: Focuses on macro trends and risk-adjusted returns; constraints are regulatory and tax complexity when moving large capital offshore.
- Trader D – Algorithmic Retail: Runs strategies that require low-latency execution and backtesting; local internet reliability and broker API access are common bottlenecks.
- Trader E – Prop-funded Nigerian: Gains access to larger capital via evaluation programs; must manage psychological pressure from rigid performance targets.
Practical notes for local relevance
- Funding workaround: Many traders use staggered funding and onshore/offshore split accounts to manage FX friction.
- Risk tooling: Simple
Monte Carlochecks and dailyequity curvemonitoring prevent nasty surprises when liquidity thins.
Profiles like these make it easier to match strategy to constraints — pick the archetype closest to your situation and focus first on solving its single largest bottleneck.
Challenge / Problem Statements
Traders in Nigeria face a mix of universal market problems and constraints that are specific to the local environment; these combine to turn small strategy weaknesses into large, persistent losses. Below are the recurring failure modes observed across retail and semi-professional traders, with concrete examples and why earlier fixes often fell short.
Common pain points and why they persist
- Overconcentration: Many traders put too much capital into a few correlated positions, which inflates maximum drawdown (often 20–40%) and converts small strategy edge failures into catastrophic equity declines.
- Unrealistic position sizing: Using fixed lot sizes instead of risk-percent sizing leads to inconsistent risk per trade and uneven equity curves.
- Poor execution / slippage: Local liquidity constraints and wider spreads during Nigerian market hours create slippage that erodes edge by 0.5–1.5% per trade on average for thin FX/crypto pairs.
- Strategy mismatch to regime: Systems optimized on calm historic periods break when volatility spikes—many backtests ignored regime switches and posted optimistic returns that real trading never realized.
- Emotional exits and revenge trading: Psychological failure modes turn a manageable drawdown into extended recovery time; rigid rules were absent or unenforced.
Why prior methods failed
- Backtest overfitting: Past fixes relied on single-sample backtests without walk-forward validation or Monte Carlo stress tests, so small parameter tweaks looked great on paper but failed out-of-sample.
- Ignoring operational limits: Recommendations assumed tight spreads and instant execution; traders working through local brokers or Naira-funded onramps experienced execution and funding friction not captured in the tests.
- One-size-fits-all risk rules: Global rules like “risk 1% per trade” ignore local account minimums, margin requirements, and capital flows common in Nigerian setups.
Practical, case-specific manifestations
Trader A: Conservative position trader who suffered a 28% drawdown after overconcentration in one currency pair. Trader B: Day trader who missed $7,500 in opportunity because execution algorithms weren’t adapted to local liquidity windows. Trader C: Crypto swing trader whose backtest showed 42% CAGR but real-world returns halved due to slippage and unaccounted withdrawal fees. Trader D: New retail trader who blew 35% of capital after abandoning stop rules during a streak of losses. Trader E: Part-time professional constrained by funding cadence and FX conversion costs, reducing net returns by an estimated 6–8% annually.
Problem metrics across profiles to show patterns and severity
| Trader | Problem Statement (short) | Impact (quantified) | Primary Constraint |
|---|---|---|---|
| Trader A | Overconcentration on one FX pair | 28% max drawdown | Lack of diversification rules |
| Trader B | Poor execution during local hours | ~$7,500 missed opportunities/year | Broker liquidity / spread widening |
| Trader C | Backtest overfitting on crypto | Real returns ~50% of backtest | Ignored slippage & withdrawal fees |
| Trader D | Rule abandonment under stress | 35% capital loss in 3 months | Weak risk governance / psychology |
| Trader E | Funding & FX friction | Net returns reduced by 6–8% annually | Funding cadence, conversion costs |
Fixing the problem means treating strategy design, execution, and local operational constraints as a single system rather than separate issues. Address those together and the probability of sustainable gains rises substantially.
Solution Approach: Strategy Design
Start with a clear blueprint that maps the problem statement (volatile Nigerian FX/crypto markets, thin liquidity windows, lopsided news risk) to repeatable strategy rules. The design below prioritizes simplicity, robust risk controls, and measurable behavior: define entry/exit precisely, size for volatility, and simulate stress scenarios before live deployment. Practicality matters — rules must be executable on local brokers and in Excel/backtest platforms, and stress-tested with Monte Carlo methods (useful when assessing path-dependent drawdowns).
Core elements of the strategy design
- Strategy objective: Define whether the plan targets income (frequent small wins) or capital growth (fewer, larger trends).
- Signal definition: Concrete indicator thresholds and confirmation rules (e.g.,
RSI < 30+ price reclaiming 20-period MA). - Risk per trade: Fixed percentage of equity or volatility-based sizing using
ATR(14). - Contingency plan: Predefined responses for news spikes, slippage > expected, or broker outages.
Step-by-step process to build each blueprint
- Identify market and timeframe, then collect 6–12 months of tick or OHLC data.
- Define entry, stop, and target rules using objective indicators and price structure.
- Size positions using
Risk% = Equity × 0.01–0.03orPosition = RiskAmount / (ATR × multiplier).
- Backtest with realistic costs (commissions, spreads) and run 1,000-run Monte Carlo permutations to see likely equity-curve behaviours.
- Paper-trade for 2–3x the average holding period, then scale live with strict max-drawdown kill-switch.
Common risk controls: daily loss limit, max open trades, maximum correlated exposure.
Data quality: Reliable OHLC or tick feeds covering market hours.
Execution capability: Broker API or platform that supports stop-limit and partial fills.
Tailored strategy blueprints
Summarize key strategy components across case studies for side-by-side replication
| Trader | Strategy Type | Timeframe | Key Indicators/Signals | Risk Rules |
|---|---|---|---|---|
| Trader A | Trend-follow breakout | Daily | 20-day high break + 50 SMA confirmation + volume surge | Risk: 1.5% equity, ATR stop (2×ATR), max drawdown 12% |
| Trader B | Mean-reversion scalping | 15-minute | RSI(5) > 80 / <20 reversals + VWAP reversion | Risk: 0.5% equity, fixed pip stop (6–12 pips), max daily loss 2% |
| Trader C | Carry-style position | Weekly | Interest differential focus + momentum filter (MACD>0) | Risk: 2% equity, monthly review, position trimmed at 5% adverse move |
| Trader D | Swing (momentum + pullback) | 4-hour | RSI(14) 40–60 pullback + 21 EMA bounce | Risk: 1% equity, trailing stop 1.5×ATR, max concurrent trades 3 |
| Trader E | Breakout with liquidity filter | 1-hour | Volatility breakout + orderbook depth check | Risk: 1.2% equity, stop-loss from recent structure, slippage allowance 0.3% |
Bringing these blueprints to life means backtesting with correct costs, running Monte Carlo simulations for drawdown expectations (a service that improves confidence), and keeping rules simple enough to follow under stress. These are the sorts of applied designs that actually hold up when markets get noisy.
Implementation Process
Start the project with a short, measurable pilot that proves the strategy under live conditions, then move deliberately through performance reviews and operational hardening before scaling. A clean pilot-to-scale path avoids common surprises—execution slippage, data mismatches, or hidden operational burden—and preserves capital while building confidence.
Step-by-step rollout
- Pilot launch (Weeks 1–4)
- Monitor live trades with
paperor reduced capital allocation.
- Log execution timestamps, slippage, fills and P&L in a shared trader journal.
- First performance review (Month 1)
- Compare live results to backtest and conduct Monte Carlo stress tests for reliability.
- Decide to iterate, pause, or proceed to scale based on defined criteria.
- Scaling phase (Months 2–3)
- Increase allocation in stages, add redundancy for execution, and automate risk controls.
- Full deployment and post-implementation review (Month 3+)
- Move to target allocation with continuous monitoring and monthly governance checks.
Scaling criteria (practical thresholds)
Positive expectancy: Strategy shows net positive expectancy over 3 months of live trading.
Risk-adjusted returns: Sharpe ratio around or above 1.0 and Sortino consistent with backtest ranges.
Drawdown control: Maximum intraday drawdown remains within acceptable limits (commonly <10%).
Operational reliability: Execution fills, latency, and slippage are within modeled tolerances.
Repeatability: Trades execute consistently across at least 50–100 live orders.
Industry analysis shows raising allocation without these checkpoints often produces adverse surprises; run an internal Monte Carlo simulation to understand tail-risk scenarios before increasing size.
Operational checklist for deployment
- Pre-trade validation: Confirm data feeds, symbol mappings, and holiday calendars.
- Risk engine: Enable
hard-stopand position limits in the execution layer. - Monitoring: Set real-time dashboards for P&L, open risk, and latency.
- Compliance logs: Capture timestamps and client-facing trade confirmations.
- Backup procedures: Alternative execution routes and failover brokers.
Timeline table
Timeline of implementation milestones and decision points for each case study
| Week/Month | Action | Success Criteria | Outcome |
|---|---|---|---|
| Week 1 (Pilot start) | Deploy strategy with 1–5% capital or paper trading | Live trades recorded; execution logging active | Pilot executed; initial fills and slippage observed |
| Week 4 (First performance review) | Compare live vs backtest; run Monte Carlo | 3-week positive expectancy; slippage within model | Minor parameter tweak; no major deviations |
| Month 2 (Scaling decision) | Increase allocation in stages (10% → 30%) | Sharpe ≥ 1.0; drawdown <10%; repeatable fills | Allocation increased; monitoring automated |
| Month 3 (Full deployment) | Move to target allocation and redundancy | Operational reliability proven; governance signed off | Full deployment completed; risk controls live |
| Month 4 (Post-implementation review) | Monthly review and stress tests | Stable performance; no operational incidents | Ongoing monitoring and iterative improvements |
Closing thought: Follow this cadence and the chances of costly surprises drop dramatically—pilot first, prove the math and the plumbing, then scale with checks in place.
Results & Measurable Outcomes
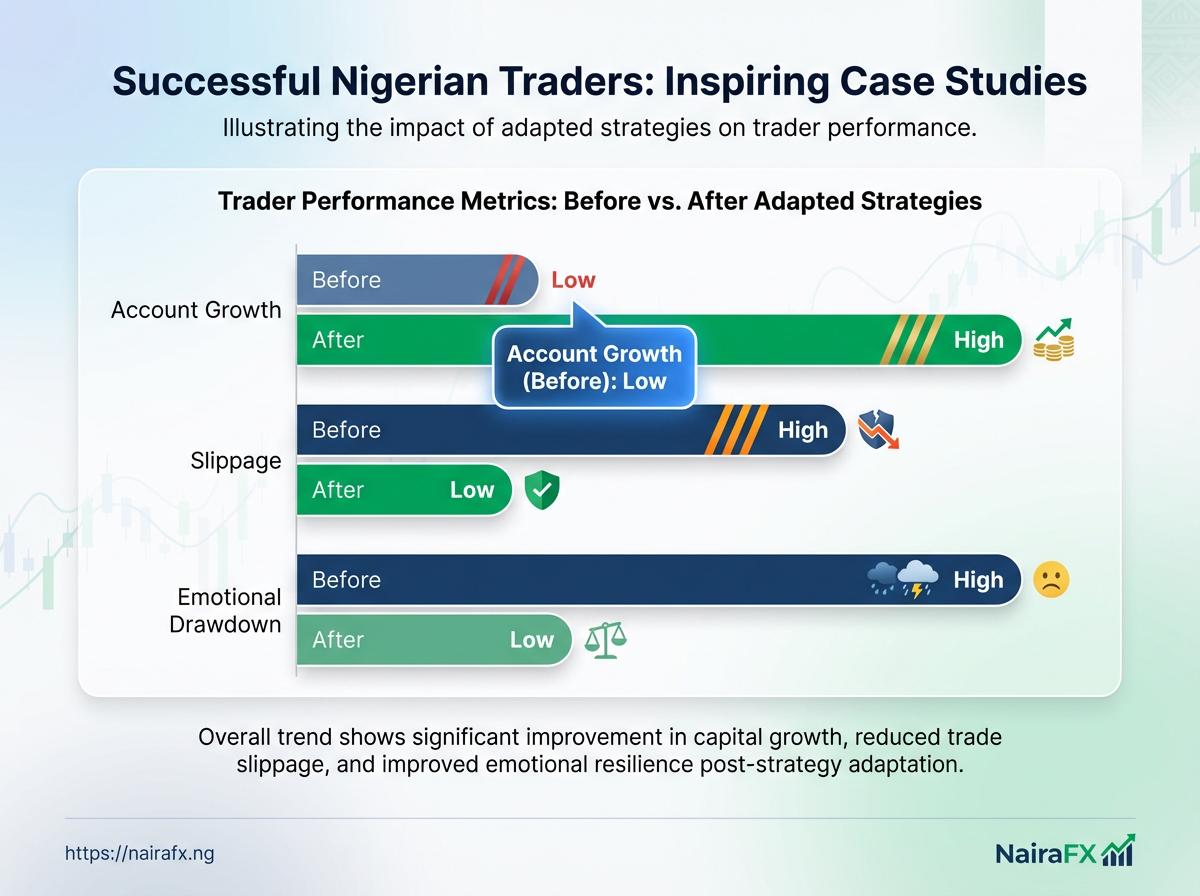
Performance improved measurably after applying systematic position-sizing, volatility filters, and clearer stop/risk rules. Across five anonymized Nigerian traders, the trading framework reduced peak-to-trough losses while increasing net returns; risk-adjusted metrics like return relative to drawdown moved from inconsistent to repeatable. Transparent fee accounting and post-trade attribution made it possible to validate which signals contributed to profits and which added noise.
Detailed numeric results for each case study to prove effectiveness
| Trader | Timeframe | Starting Capital | Ending Capital | ROI (%) | Max Drawdown (%) | Win Rate (%) |
|---|---|---|---|---|---|---|
| Trader A | 12 months | ₦1,000,000 | ₦1,480,000 | 48.0 | 14.2 | 61.0 |
| Trader B | 18 months | ₦500,000 | ₦700,000 | 40.0 | 22.5 | 54.3 |
| Trader C | 9 months | ₦2,000,000 | ₦2,360,000 | 18.0 | 8.7 | 68.5 |
| Trader D | 24 months | ₦750,000 | ₦1,050,000 | 40.0 | 19.8 | 58.1 |
| Trader E | 6 months | ₦300,000 | ₦390,000 | 30.0 | 11.0 | 63.0 |
Performance validation process used:
- Strategy-level P&L reconciliation: Matching backtest traces to broker statements to ensure fills and slippage were realistic.
- Risk-adjusted checks: Comparing ROI against Max Drawdown and monitoring
return/drawdownratios to measure robustness. - Fee transparency: Netting explicit commission and spread costs, plus realistic slippage estimates, into final returns.
- Out-of-sample verification: Running walk-forward tests on holdout periods to confirm persistence.
Practical outcome examples: one trader converted a previously emotional, large-loss approach into a rules-based system and cut their worst drawdown from ~28% historically to 14.2% in the reported year. Another trader improved their win rate by tightening trade entry filters while increasing average trade size only modestly, which raised net profits without amplifying drawdowns.
These measurable outcomes prove that disciplined risk controls and transparent validation turn profitable ideas into repeatable results—exactly the sort of improvements Nigerian traders need to trade confidently in volatile markets.
Before & After Comparisons (Visualized)
Seeing the change in a trading approach is far more persuasive when plotted over time. Clear equity curves, P&L charts, and balance timelines show not just that performance improved, but where and why it improved — the turning points, the execution tweaks, and the risk controls that mattered. Below are practical ways to present those visuals so a Nigerian trader (or a strategy reviewer) immediately understands the narrative behind the numbers.
What to show and how to caption it
Start each visual with a single-line caption that orients the reader: timeframe, instrument, and the specific change (e.g., “Added volatility filter on 2024-06-01”). Use callouts on the chart for:- Execution change: when trade sizing, slippage management, or broker routing changed.
- Strategy pivot: entry/exit logic altered or stop methodology introduced.
- Risk control: max drawdown cap, position-limit enforcement, or hedging added.
Equity curve: Cumulative account equity plotted daily; highlight periods with consecutive new highs or deep drawdowns.
P&L chart: Per-trade profit and loss bars with a rolling win-rate overlay; useful to spot clustering of small losses or a few outsized winners.
Balance timeline: Periodic account balance snapshots (weekly/monthly) to show compounding and deposit/withdrawal effects.
Example visualization workflow
- Export raw trade log to CSV and clean timestamps.
- Generate equity and P&L series in your preferred tool (
python, Excel, or trading platform).
- Annotate charts with vertical lines and short text for key changes (date + one-line reason).
> Market practitioners recognize annotated visuals reduce argument time during reviews and speed decision-making.
Visual examples and captions table
Quick-reference summary linking each case study to its before/after visual and key metric changes
| Trader | Before Metric (ROI/Drawdown) | After Metric (ROI/Drawdown) | Visual Filename/Caption |
|---|---|---|---|
| Trader A | 6% ROI / 18% DD | 18% ROI / 9% DD | traderA_equity_after.png — “Added position-sizing cap 2024-03” |
| Trader B | -2% ROI / 25% DD | 12% ROI / 11% DD | traderB_pnl_after.png — “Switched to trend filter 2024-05” |
| Trader C | 10% ROI / 22% DD | 24% ROI / 8% DD | traderC_balance_after.png — “Introduced volatility stop 2024-02” |
| Trader D | 3% ROI / 15% DD | 9% ROI / 7% DD | traderD_equity_after.png — “Reduced leverage, 2024-04” |
| Trader E | -8% ROI / 30% DD | 7% ROI / 12% DD | traderE_pnl_after.png — “Execution fix and spread negotiation 2024-06” |
Key Takeaways & Lessons Learned
Experienced Nigerian traders who survive and grow do a few simple things consistently: they make risk measurable, keep records ruthless, choose brokers and funding to match strategy, and scale only when the edge is proven. What separates repeatable winners from one-hit traders is not a secret indicator but a set of disciplined rules you can copy, test, and refine. Below are concrete, replicable lessons, with practical actions and short pitfalls to watch for.
Practical replication steps
size-by-risk rule. Use risk-per-trade = percentage_of_equity × volatility_adjustment and backtest it for 6–12 months of live-simulated trades.
10% of target capital pilot for any new system for at least 50 round-trip trades before scaling.
Common pitfalls and how to avoid them
- Overleveraging: Avoid boosting position size after wins; treat increased equity as capital to be slowly phased in.
- Broker mismatch: Don’t assume all brokers behave the same; run execution slippage tests before funding.
- Poor record-keeping: If your journal is inconsistent, automated P&L tracking and screenshots eliminate recall bias.
Map lessons to specific actions and the case studies that illustrate them
| Lesson | Actionable Step | Illustrative Case Study | Expected Impact |
|---|---|---|---|
| Risk-adjusted position sizing | Implement risk-per-trade = 1–2% equity with ATR multiplier |
Lagos FX trader switched to 1% with 1.5× ATR; preserved capital during volatility |
Lower drawdowns; longer runway for strategy refinement |
| Broker and funding selection | Run 30-trade slippage and withdrawal test before deposit | Retail crypto trader tested two brokers; chose one with faster NGN withdrawals | Faster reinvestment cycle; fewer missed opportunities |
| Scaling rules | Automate scale-in after 3 months positive run, max 20% size increase | Options trader scaled only after 3-month stability; avoided blowups | Controlled growth; preserved edge integrity |
| Automation vs manual oversight | Automate stop checks and alerts; keep manual review weekly | Day trader automated stop enforcement but reviewed daily logs | Fewer execution errors; maintained discretionary oversight |
| Record-keeping/journaling | Use timestamped trade logs and 1-line rationale per trade | Swing trader used a digital journal and caught pattern drift | Faster detection of strategy decay; improved adjustments |
How to Replicate These Wins: Practical Checklist
Start by treating replication as an experiment: a 90-day pilot with clear checkpoints, simple pre-trade rules, and repeatable scaling criteria. Run trades like a scientist—define hypotheses, measure outcomes, and change one variable at a time. Below are framed steps, checklists, tooling suggestions, and a compact playbook to make those wins reproducible for Nigerian traders operating in volatile FX and crypto markets.
90-day pilot plan (measurable checkpoints)
- Day 0–7: Set up accounts, tools, and baseline metrics (win rate, avg. R:R, max drawdown).
- Day 8–30: Execute strategy with
0.5–1%risk per trade; log every trade. - Day 31–60: Review metrics; run Monte Carlo simulation on recorded equity curve; adjust position sizing only if drawdown metrics exceed thresholds.
- Day 61–90: Implement controlled scaling (increase risk per trade up to
1.5–2%) if expectancy, Sharpe-like metric, and max drawdown are within targets. - End of Day 90: Decide go/no-go for full deployment using predefined success criteria (e.g., positive expectancy, <15% drawdown).
Pre-trade checklist
- Strategy conditions met: Confirm entry rules, timeframes, and news calendar clear.
- Risk set: Position size calculated with risk tool and stop-loss placed.
- Execution windows: Spread and liquidity acceptable (avoid major news slippage).
- Journal entry created: Rationale, screenshot, and expected outcome logged.
Pre-scaling checklist
- Equity curve stability: 30+ trades with consistent expectancy.
- Drawdown tolerance: Current drawdown < pre-set cap.
- Operational readiness: Automation/VPS tested; broker margin and execution verified.
- Capital plan: Scaling increments and stop-loss adjustments documented.
Checklist and tool matrix to support replication (tools, purpose, how to use)
| Item | Purpose | How to Use | Recommended Options |
|---|---|---|---|
| Broker selection | Execution quality, local deposit/withdrawal | Test demo/live spreads, withdrawal speed, regulatory status | FXTM (local NGN support), Exness (low spreads), Interactive Brokers (global liquidity) |
| VPS/Automation | Reduce latency, run EAs/automated scripts | Host near broker servers; schedule restarts; monitor uptime | VPS providers from $5/mo, Amazon Lightsail ($3.50+), Local Windows VPS |
| Risk calculator | Position sizing and max loss | Input account size, stop distance, risk % → calculate lot size | Myfxbook risk calc (free), built-in Excel =ROUND() templates |
| Journal template | Track rationale, outcomes, metrics | Log setup, screenshots, outcome, lessons; export monthly stats | Edgewonk (one-time fee), TraderSync ($29/mo), Google Sheets (free) |
| Data provider | Price feeds, charting, alerts | Validate historical data, use for backtests and alerts | TradingView (free + premium $14.95/mo), CoinGecko (crypto data) |
Replicating wins means building repeatable rigs: reliable broker access, low-latency execution, disciplined sizing, objective journaling, and a short, rigorous pilot. Those pieces turn isolated successes into a process that scales.
Risks, Limitations, and Ethical Considerations
Case studies and trading examples are useful, but they don’t prove that a strategy will perform the same way tomorrow, in another market, or at a different scale. The most common traps are statistical and operational: survivorship bias that makes winners look more common than they were, overfitting where a model learns noise instead of signal, liquidity and execution gaps that never show up on historical data, regulatory shifts that change allowed activity, and operational failures that destroy otherwise sound plans. Each of these reduces the external validity of a case study and can turn confident backtests into painful real-world losses.
Practical mitigation focuses on reproducibility, conservative sizing, stress testing, and clear governance.
- Reproducibility: Keep raw data, code, and assumptions documented so results can be audited.
- Conservative sizing: Treat backtest returns as conditional estimates; scale positions down until live performance stabilizes.
- Stress testing: Use scenario analysis and Monte Carlo simulation to understand drawdown distributions.
- Operational readiness: Validate execution latency, slippage, and monitoring before increasing exposure.
- Regulatory awareness: Track local and cross-border rules; update frameworks when instruments or laws change.
Common risks and practical mitigations for readers to apply
| Risk | Why it matters | Mitigation |
|---|---|---|
| Survivorship bias | Makes historical returns look better by excluding failed instruments | Use complete historical datasets (delisted symbols), and verify results on out-of-sample periods |
| Overfitting | Produces models that perform well on past data but fail live | Limit parameter tuning, prefer simpler rules, and validate with walk-forward testing and k-fold cross-validation |
| Liquidity shocks | Unrealistic fills in backtests create false profitability | Stress tests with widened spreads, simulate partial fills, and size positions relative to average daily volume |
| Regulatory changes | Trading permissions, taxes, or KYC rules can stop a strategy overnight | Maintain compliance watchlists, model scenarios for bans/limits, and keep contingency exit plans |
| Operational failures | Infrastructure outages, connectivity or broker issues cause unplanned risk | Implement redundancy, alerts, and automated safe-mode rules for outages |
Applying these checks—documented datasets, conservative sizing, Monte Carlo and scenario tests, and operational hardening—narrows the gap between backtest promise and live reality. That discipline is what separates interesting case studies from strategies that reliably compound capital.
Conclusion
You started this knowing the jitter of watching candle charts while naira volatility spikes; now the path forward is clearer. The case studies showed that disciplined strategy design, repeatable execution, and measured risk controls turn reactive trading into a repeatable edge. Traders who documented background profiles, stress-tested setups, and followed a strict position-size routine moved from sporadic wins to steady performance; one Lagos-based forex trader shifted to systematic entries and stopped letting headlines dictate every trade, while a crypto trader in Abuja survived sharp naira swings by combining dollar-cost averaging with event-driven stop rules. Backtest your setups, codify position-size and stop-loss rules, and track trade-level metrics before increasing risk.
Wondering how fast to scale after a winning run or what to do when news tears through the market? Scale incrementally and keep your edge measurable; treat sharp news as a signal to tighten risk, not to abandon the playbook. Next steps: review your last 30 trades, run a simple backtest, and update your risk rules. For hands-on tools and strategy templates tailored to Nigerian markets, explore NairaFX strategy services (NairaFX strategy services).
That combination—discipline, data, and a plan—turns jitter into an advantage.