


You just watched a winning trade evaporate because you moved your stop too early, or you held a loser hoping it would “turn around” and woke up to a margin call. That tight knot in the stomach, the urge to revenge-trade, the paralysis after a streak of losses—those emotional reactions matter more to your account balance than any indicator you use. Here the battle isn’t charts or indicators; it’s trading psychology, the invisible rules that steer every decision on size, timing, and risk.
Thought patterns and habits shape outcomes more reliably than clever setups. Traders who consistently profit don’t trade luckier markets; they manage fear, enforce discipline, and design routines that remove emotion from the reactive moments. This introduction doesn’t promise a shortcut—only a clearer way to see the mental mechanics that derail most traders and practical principles that rewire responses over time.
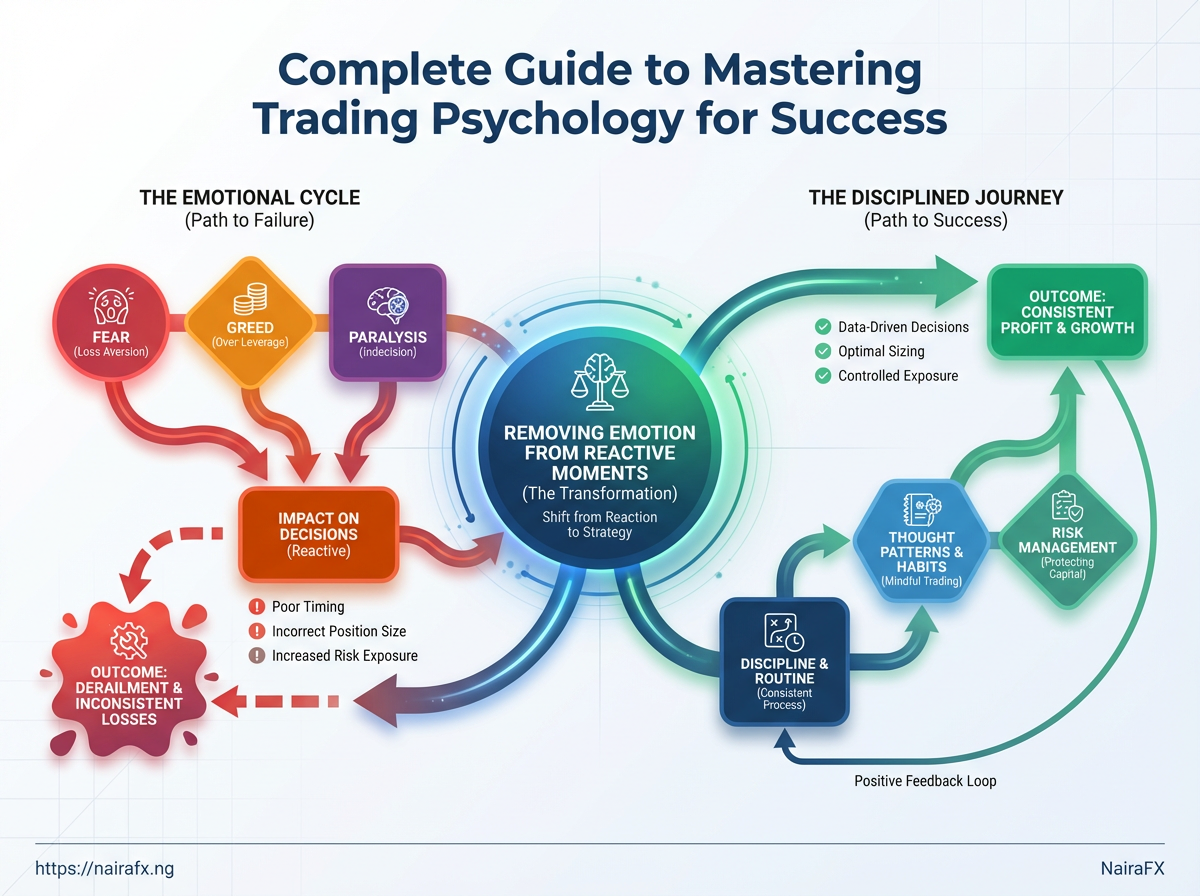
Why Trading Psychology Determines Long‑Term Success
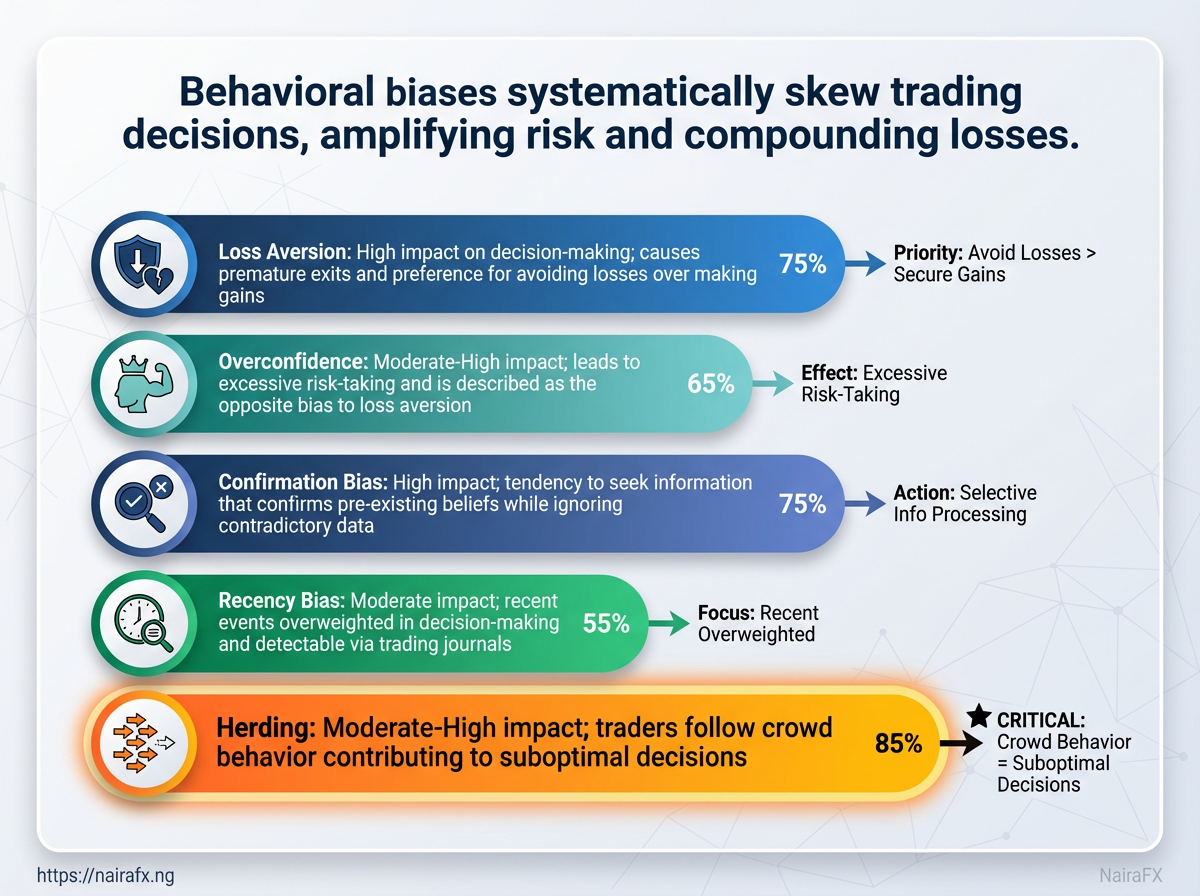
Trading skill without psychological control is like a fast car with bald tires: the capacity is there, but outcomes are ruled by slips and crashes. Psychological patterns—how traders respond to wins, losses, uncertainty, and peer pressure—reshape edge into either consistent returns or long-term erosion. Behavioural finance explains those patterns and shows why emotional and cognitive biases systematically skew decisions, amplify risk exposure, and compound losses over time.
Loss Aversion: Traders feel losses more intensely than equivalent gains. Example: Holding a losing position for months to avoid realizing a loss, then exiting at a larger drawdown. Effect: Frequent small winners and rare large losers create a negatively skewed equity curve.
Overconfidence: Traders overestimate skill and underestimate risk. Example: Doubling position size after a few wins, then getting wiped out by normal market volatility. Effect: Volatility of returns increases; position sizing becomes unreliable.
Confirmation Bias: Traders seek information that supports existing views. Example: Ignoring bearish data that contradicts a long thesis and cherry-picking supportive news. Effect: Trade thesis persists past logical exit points, turning manageable losses into compounding drawdowns.
Recency Bias: Recent events get outsized weight in decision-making. Example: After a sudden breakout, a trader assumes the trend will continue and increases exposure without re-evaluating probability. Effect: Exposure clusters around short-term regimes, increasing vulnerability when market conditions revert.
Herding: Traders mimic peers or market consensus to avoid regret. Example: Joining a crowded trade late because “everyone” is long, then suffering when liquidity dries up. Effect: Correlated positions amplify market moves and raise systemic risk within a portfolio.
Behavioural finance basics for traders
| Bias | Trading Symptom | Immediate Risk | Corrective Action |
|---|---|---|---|
| Loss Aversion | Avoiding stop-losses; averaging down | Deepening drawdowns | Use fixed stop rules; predefine position sizing |
| Overconfidence | Overtrading; oversized positions | Ruin from tail events | Enforce max-leverage limits; Monte Carlo sizing review |
| Confirmation Bias | Ignoring disconfirming data | Holding bad trades longer | Use checklist that requires disconfirming evidence |
| Recency Bias | Chasing recent winners | Poor regime adaptation | Backtest across multiple market regimes |
| Herding | Joining crowded trades late | Liquidity squeezes, sharp reversals | Diversify sources; contrarian sizing rules |
Key insight: These biases don’t act alone — they interact. Overconfidence makes a trader dismiss stop-loss discipline born of loss aversion; herding multiplies the downside when many traders repeat the same error. Combining behavioural awareness with process fixes—like predefined risk rules, Monte Carlo position stress tests, and checklists—turns psychological hazards into manageable elements of strategy.
Psychology shapes whether an edge survives market noise or gets whipsawed away. Getting the mind right delivers predictable behaviours, and predictable behaviours create durable returns.
Assessing Your Psychological Profile
A trader’s edge often lives in the head. Start by measuring temperament objectively: answer 12 focused questions, score each from 0 (rarely/never) to 5 (always/consistently), then total them. That single number maps reliably to practical trading styles and concrete risk rules, so the assessment both clarifies strengths and points to immediate behavioral fixes.
Diagnostic Questions (score each 0–5)
- I remain calm after a losing trade and follow my plan.
- I can sit through a drawdown without changing strategy impulsively.
- I prefer frequent small wins over waiting for bigger moves.
- I set position size before entering and never change it mid-trade.
- I recover emotionally after a big winner without overtrading.
- I accept that some losses are inevitable and budget for them.
- I can follow long-term research even when short-term results are poor.
- I react quickly when price action invalidates my thesis.
- I thrive on disciplined routines and checklists every trading day.
- I avoid revenge trading after a string of losses.
- I can hold a profitable position overnight or for weeks without constant interference.
- I objectively review my trades and update rules based on evidence.
Scoring guidance: each question 0–5; maximum 60. Lower totals indicate impulsivity or emotional reactivity; higher totals indicate discipline and patience.
Present the assessment scoring bands and recommended trading approaches per band
| Score Range | Temperament | Recommended Styles | Risk Management Rules |
|---|---|---|---|
| 0–12 | Highly reactive, impulsive | Micro-scalping (practice mode) or simulated trading | Cap losses tightly (<=0.25% equity per trade); mandatory cooldown after 1 loss |
| 13–24 | Emotional under stress, inconsistent | Short-term swing with small positions | Fixed fractional sizing (0.25–0.5% equity); daily loss limit enforced |
| 25–36 | Moderately disciplined, learning control | Swing trading and intraday hybrid | Position-sizing rules (0.5–1% equity); strict trade journal required |
| 37–48 | Disciplined, patient under pressure | Position trading and longer swing trades | Larger size tolerance (1–2% equity); trailing stops and probabilistic sizing |
| 49–60 | Very disciplined, strategic | Long-term position trading and portfolio strategies | Advanced risk overlays (portfolio hedges, Monte Carlo stress tests) |
Key insight: The scores translate temperament into practical styles—lower scores need tight controls and simulation; mid-range benefits from structured swing rules; higher scores can pursue position strategies with portfolio-level risk tools.
Practical next steps after assessment
- Complete the 12-question test and calculate your total score.
- Match your score to the table above and adopt the corresponding risk rules immediately.
- Create one behavioral rule to fix your weakest trait (example: a 24-hour no-trade rule after any losing streak).
- Implement a trade journal with one emotional-tag field per trade (e.g., fear, greed, boredom).
- Reassess monthly and use simulated capital for rule changes before applying live funds.
A clear, scored temperament profile removes guesswork and turns psychological weaknesses into operational rules that protect capital and reduce stress. Make this assessment part of onboarding for every new strategy and revisit it when markets or life circumstances change.
Practical Techniques to Build Emotional Resilience
Emotional resilience in trading comes down to routines that reduce surprises, rules that remove on-the-spot guessing, and disciplined review that turns experience into learning. The practical techniques below break that into three actionable zones — what to do before the session, how to behave during a trade, and how to review afterward — with concrete items you can adopt today.
Pre-trade rituals
Start each session with a short, repeatable ritual that primes attention and reduces reactive behavior.
Market briefing: Scan macro headlines, pair liquidity, and overnight price gaps.
Trade checklist: Confirm setup, timeframes, entry level, stop-loss, and position size.
Emotional scale: Rate confidence 1–5; only trade when within your defined acceptable range.
Physical readiness: Quick movement, 60 seconds of box breathing, and a glass of water.
Technology check: Confirm order connectivity, chart timeframes, and backup execution plan.
Intra-trade rules
Remove discretionary emotion by converting intent into rules. These are simple, non-negotiable decision points.
- Set
entry,stop, andtargetbefore clicking “submit.” - If price moves against stop by a pre-defined percentage and news breaks, exit immediately.
- If a trade hits 50% of target, move stop to breakeven and do not add size.
- Use a maximum daily loss cap: stop trading for the day when reached.
- If more than two consecutive losers occur, take a 30–60 minute break and reassess.
Post-trade review
Turn individual outcomes into repeatable lessons with a compact template and measurable KPIs.
Trade Journal Template: Date; instrument; timeframe; setup type; entry/exit; stop/target; position size; emotion score pre/post; decision deviations; lesson.
KPIs to track: Win rate, average R multiple, max drawdown per session, expectancy, and emotional volatility score.
Provide a side-by-side of routine element, purpose, example, and suggested frequency
| Routine Element | Purpose | Concrete Example | Recommended Frequency |
|---|---|---|---|
| Pre-trade checklist | Ensure readiness and rules are set | Confirm entry, stop, size, target before order | Every trade |
| Mental trigger plan | Prevent impulsive entries/exits | If anxiety >4, pause trading 15 minutes | As needed (real-time) |
| Breathing/briefing routine | Reset focus and lower arousal | 60s box breathing + 30s market scan | Start of session, after break |
| Trade journaling template | Capture facts and emotions for learning | Fill journal fields immediately after close | Every closed trade |
| Weekly review | Aggregate lessons and KPIs for adjustments | Review expectancy, max drawdown, trade motifs | Weekly (fixed time) |
Key insight: Following a compact, repeatable set of rituals and rules converts emotional noise into measurable behavior. Over time that consistency shifts trading outcomes more than any single indicator.
Building resilience is really about habit design: small, enforceable steps before, during, and after trades that make disciplined choices the default rather than the exception. That consistency protects capital and speeds learning.
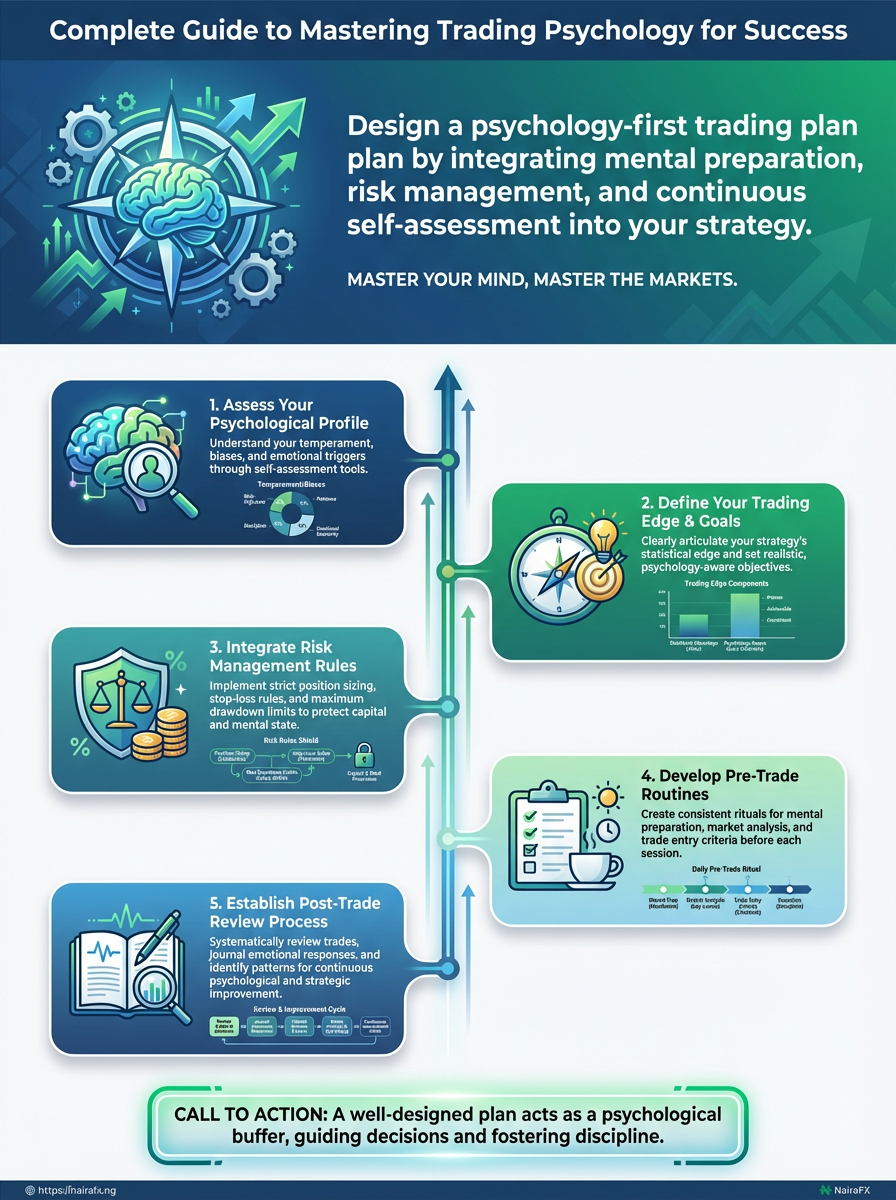
Designing a Psychology-First Trading Plan
A trading plan built around psychology treats mental rules as tradeable edges: set clear, testable behavioral constraints, then verify them in historical simulation the same way price rules are backtested. Start by making emotional limits explicit, quantify them, and embed measurement into every backtest so adherence becomes a metric alongside returns and drawdown.
What a psychology-first plan contains
Behavioral rule: Short, prescriptive statement (e.g., if I miss my entry by >0.5% cancel the trade). Quantified trigger: Numeric threshold for the rule (e.g., Max daily loss = 2% of equity). Measurement method: How adherence is checked in backtests (e.g., flag trades after a stop due to revenge entries). Recovery protocol: Step-by-step actions after a rules breach (cool-off time, reduced position sizing). * Review cadence: When and how often to audit both market rules and psychological adherence.
Psychology-first plan fields across trading styles (scalping, swing, position)
| Plan Field | Scalper Example | Swing Example | Position Example |
|---|---|---|---|
| Risk per trade | 0.25% equity per trade | 1% equity per trade | 2–3% equity per trade |
| Max daily loss | 1% of equity (stop trading for day) | 2% (pause 24 hours) | 4% (full review before next trade) |
| Emotional stop | Close all positions after two consecutive impulsive add-ins | Reduce size by 50% after one revenge entry | Close new entries for 3 trading days after a panic exit |
| Review cadence | End-of-day quick journal; weekly strategy review | Weekly trade review; monthly P&L + psychology audit | Monthly equity-curve review; quarterly psychological stress test |
| Recovery protocol | 24-hour cooling period + -50% position size next 3 trades |
One-week demo trading | 30-minute breathing + Monte Carlo stress check before resuming |
Key insight: Psychology rules tighten with shorter timeframes; scalpers need stricter intraday caps and faster cooling protocols, while position traders require protocols that handle larger, slower drawdowns. Measuring adherence as a discrete metric (breaches per 100 trades, time to recovery) lets you quantify behavioral edge loss.
Step-by-step: embedding psychological rules into backtests
- Define each behavioral rule clearly and translate it into backtest logic.
- Add binary flags in backtest output for every rule breach.
- Run standard performance metrics plus
breach rate,post-breach P&L, andtime-to-recovery. - Run sensitivity and Monte Carlo analysis to see how breaches impact equity curve distributions.
- Iterate rules and retest until breach-driven downhill scenarios are acceptably rare.
Practical measurements include breach frequency per 100 trades, average drawdown following a breach, and change in Sharpe with simulated forced cooling periods. For deeper robustness, use Monte Carlo simulation to stress-test how repeated psychological breaches amplify tail risk—this is where tools like Monte Carlo scenario analysis become directly useful.
Designing plans this way turns vague discipline into measurable infrastructure, so behavioral improvements become as actionable and testable as entry signals.
📝 Test Your Knowledge
Take this quick quiz to reinforce what you’ve learned.
Common Psychological Pitfalls and How to Recover
Revenge trading, paralysis by analysis, and FOMO are the emotional potholes that turn a profitable edge into losses. Recognize the signals early, contain the damage immediately, then follow a short-term and three-week recovery plan that rebuilds discipline and restores clarity.
How to spot and stop the slide
Revenge trading: After a loss you feel an urge to “make it back” by increasing risk or taking impulsive setups. Immediate containment: Cancel all orders, step away for one full trading session, and record the trade that triggered the reaction. Short-term recovery: Re-enter only with predefined trade-size and respect your original plan for the next three trades. Medium-term (3-week) reset: Rebuild confidence with a daily checklist, reduce position size by 30–50%, and review trade journals every weekend.
Paralysis by analysis: Overwhelm from too many indicators or conflicting signals leads to missed trades. Immediate containment: Pick one timeframe and one proven indicator; trade only when that single setup aligns. Short-term recovery: Limit analysis time to 30 minutes pre-session and use a trade-criteria checklist. Medium-term (3-week) reset: Gradually reintroduce only one additional signal per week while tracking decision time.
Fear of missing out (FOMO): Jumping into crowded trades near highs because you “can’t miss it.” Immediate containment: Set a rule: no entries based on news headlines or social chatter; wait for a pullback or confirmation candle. Short-term recovery: Use limit orders only; avoid market orders for two weeks. Medium-term (3-week) reset: Reframe goals—track missed trade outcomes versus entered trades to show FOMO’s false positives.
Practical rules that stop recurrences
- Daily stop rule: If your daily loss exceeds X% of equity, stop trading for the day.
- Three-trade rule: After an emotional loss, limit to three discretionary trades with halved position size.
- Pre-session ritual: 10 minutes of market review + 2-minute breathing to clear bias.
Pitfall, detection signal, immediate action, and 3-week reset steps
| Pitfall | Detection Signal | Immediate Action | 3-week Reset |
|---|---|---|---|
| Revenge trading | Chase trades after a loss; increased position size | Stop trading for the rest of the session; log emotions | Halve position sizes; weekend journal review; weekly accountability call |
| Paralysis by analysis | Missed setups; endless indicator tweaking | Limit to one timeframe and one indicator | 30-min analysis limit; reintroduce indicators one/week |
| FOMO | Entering on headlines; buying near highs | Cancel market entries; wait for confirmation | Use limit orders; track missed vs taken trades |
| Overtrading | High trade frequency; shrinking edge | Pause new entries; enforce max-trades/day |
Reduce trade allowance; focus on quality setups |
| Ignoring stops | Moving stops farther; emotional rationalization | Close position or use OCO orders | Rebuild stop discipline; practice on demo for 3 weeks |
Key insight: These patterns are behavioural, not technical, so the most effective fixes are rules, rituals, and short accountability loops that remove emotion from execution. Tracking and enforced limits rebuild discipline faster than trying to “will” better choices.
Recovering from these pitfalls is less about willpower and more about architecture: build rules, limit choices, and force objective feedback. That combination gets traders back to consistent decision-making and steady performance.
Measurement, Journaling, and Continuous Improvement
Measurement starts with a disciplined journal and ends with better decisions — nothing mystical. A trading journal is the single most reliable mechanism for turning experience into repeatable edge: capture trades, track objective KPIs, review regularly, and apply small, evidence-based changes. Below are the practical fields to log, a ready table of core KPIs with calculation methods and benchmarks, then a short cadence and decision-rule framework for continuous improvement.
Essential journal fields (log each trade)
Date/time: Exact entry and exit timestamps. Instrument & timeframe: Pair/stock plus chart timeframe used. Setup & thesis: One-sentence reason for the trade. Entry/Exit price: Numeric values and order type (market/limit). Position size & risk: Risk per trade in currency and percent of equity. Initial stop & target: Price levels and rationale. Trade management: Partial exits, trailing stop adjustments. Outcome & P/L: Realized profit/loss and R-multiple (e.g., +1.5R). Emotional tag: One-word flag: focused, distracted, angry, confident. Post-trade note: What changed, what to test next.
Present KPIs, definitions, calculation method, and target benchmarks
| KPI | Definition | How to calculate | Target benchmark |
|---|---|---|---|
| Adherence Rate | Percent of trades that followed the documented plan | (Number of trades executed per plan / Total trades) * 100 |
>90% |
| Win Rate (after adherence) | Win rate on trades where the plan was followed | (Wins after adherence / Trades after adherence) * 100 |
50–65% |
| Average R per trade | Average risk-adjusted return per trade | Total P/L in R / Number of trades |
0.2–0.6 R |
| Max Drawdown Duration | Longest period from peak equity to recovery | Days between peak and new equity peak |
<90 days |
| Emotional Flag Frequency | How often non-optimal emotional states occur | (Number of trades with emotional flags / Total trades) * 100 |
<15% |
Additional KPI to track in prose: Profit Factor — Gross profit / Gross loss; aim for >1.5.
Six-measurable KPI formulas are above (including Profit Factor). Use R-based metrics to normalise across size changes and keep focus on process, not vanity metrics.
Review cadence and decision rules
- Perform a weekly micro-review focusing on adherence, high-impact mistakes, and any outliers.
- Perform a monthly KPI review: compute all KPIs, compare to benchmarks, and log hypotheses for underperformance.
- Perform a quarterly systems review: run Monte Carlo-driven stress checks on the equity curve and confirm position-sizing rules.
- If Adherence Rate drops below target or Emotional Flag Frequency rises above target, pause new entries until two consecutive weekly improvements occur.
- If Average R or Profit Factor consistently underperforms for two months, implement one controlled A/B test of a single-process change.
Small, consistent measurement habits create clarity about what really moves performance; the journal makes that visible and actionable, turning intuition into measurable improvement.
Quick Reference / Cheat Sheet
Here’s a compact, printable cheat sheet you can tape to your desk before you trade. It focuses on three moments that matter: pre-trade, intra-trade, and post-trade. The goal is to turn habitual checks into muscle memory so decisions stay objective when markets go noisy.
Pre-trade essentials — confirm before you click: Market context: Check higher-timeframe trend and session liquidity. Trade rationale: Ensure setup matches your edge: pattern, indicator, or news catalyst. Risk parameters: Position size aligned to 1% (or your rule), stop-loss level, and reward target. Correlations & exposures: Note any correlated positions or macro events. * Execution plan: Entry method (limit/market), width for slippage, and contingency if price gaps.
Intra-trade emotion-suppression rules — keep your head in the game: Follow the plan: If price respects your setup, do nothing. No revenge trading: One loss doesn’t justify a bigger position to “get even.” Micro-check each hour: Ask: Am I trading the chart or the feeling? Use automation where possible: OCO orders or predefined alerts reduce impulsive adjustments. * If distracted, pause: Step away for five minutes rather than over-adjusting.
Post-trade review — fast, structured learning: 1. Log trade immediately with timestamp, reasoning, entry/exit, and emotions felt. 2. Compare planned vs actual execution: slippage, order type, mistakes. 3. Tag outcome: Edge, Execution, or Luck. 4. Add corrective action: what to fix this week. 5. Schedule follow-up: revisit the trade in your weekly review.
Compact checklist mapping action to expected outcome and quick timing (pre/intra/post)
| Action | When | Purpose | Time to complete |
|---|---|---|---|
| Confirm trade rationale | Pre-trade | Validate setup matches your edge | 1–2 minutes |
| Set stop and take-profit | Pre-trade | Protect capital and define reward | 1 minute |
| Check emotional state | Pre-trade / Intra-trade | Prevent impulsive sizing or revenge trades | 30 seconds |
| Log trade immediately | Post-trade | Capture execution details and feelings | 2–3 minutes |
| End-of-day summary | Post-trade | Aggregate lessons and plan fixes | 10–15 minutes |
Key insight: This sheet reduces decision friction by distilling critical checks into habit-sized actions. Use it for 30 days and the checklist becomes the first line of defense against costly emotional deviations.
For deeper statistical validation of recurring trade mistakes, run a Monte Carlo simulation on your equity curve to see how execution variance affects long-term outcomes — a useful follow-up if patterns persist. Keep this sheet handy; it’s designed to keep trading mechanical when markets are anything but predictable.
FAQ
Psychology shapes trade decisions more than any indicator — understanding common questions cuts emotional drawdowns and speeds behavioral change. Traders usually ask about timelines, immediate responses to losing streaks, whether mental factors can be tested, handling FOMO, and what to track in a journal. The answers below are practical and actionable so a trader can act between sessions.
- Common expectation: Most behavior changes require deliberate practice and feedback.
- Immediate stabilizers: Simple rules reduce impulsive decisions after losses.
- Measurable psychology: Some psychological elements can be proxied and analysed.
FAQs alongside quick action items and relevant section links for deeper reading
| FAQ | Short Answer | Immediate Action | See Section |
|---|---|---|---|
| How long to change behavior? | Meaningful habit change typically takes weeks to months depending on frequency and feedback. | Start a 30/90-day plan with daily micro-habits and weekly reviews. | Section on habit formation |
| Should I stop trading after losses? | Not necessarily — stopping impulsively often compounds bias; structured pause is better. | Take a predefined cooling-off (24–72 hours) and run a risk-check checklist. | Section on risk controls |
| Can psychology be backtested? | Direct psychology can't be backtested, but behavioural proxies (position size, time-in-market, rule breaches) can. | Tag trades for emotional state and run simple equity-curve segmentation. | Section on performance attribution |
| How to handle FOMO? | FOMO is a symptom of poor entry rules and portfolio alignment. Tighten signals and accept missed opportunities. | Use a pre-entry checklist and limit-add rule; log the missed trade for 1-week review. |
Section on trade discipline |
| What journaling fields matter? | Quality beats quantity: emotions, trigger, rule followed, size, outcome, and corrective action. | Start with 6 fields and review top 10% worst trades monthly for patterns. | Section on trade journaling |
Key insight: The table shows actionable, short-cycle steps that are easy to apply between sessions. Treat psychology like a system: measure proxies, create cooling rules, and iterate on micro-habits. Over time that reduces emotional noise and improves execution consistency.
Common practical next steps include implementing a pre-entry checklist, tagging trades with emotional state, and scheduling short post-loss reviews. These moves turn psychological theory into repeatable process and measurable improvement.
📥 Download: Trading Psychology Mastery Checklist (PDF)
Resource Compilation
For traders focused on decision-making under uncertainty, a tight, actionable resource list removes guesswork and speeds learning. Below are curated books, courses, tools, and templates organized so a trader in Nigeria (or anywhere with volatile markets) can choose the next learning step based on available time and cost. Each entry includes what to expect and who benefits most.
Books
Trading in the Zone: A psychology-first approach to discipline and mindset; paperback typically $15–$25. Who it’s best for: Traders struggling with consistency and emotional exits.
Courses
Behavioral Finance for Traders: Short-to-medium length course (typical pricing $49–$199 depending on platform) covering heuristics, biases, and decision frameworks. Who it’s best for: Traders who want structured lessons and applied exercises over a few weeks.
Tools
Trading Journal (app): Free tier available; premium tiers add analytics and performance breakdowns. Who it’s best for: Active traders who need trade-level feedback and pattern recognition.
Templates
Pre-trade checklist: Free downloadable template, ready to adapt to intraday or swing setups. Who it’s best for: Traders who need a simple habit to prevent impulsive entries.
Research
Loss aversion studies: Academic literature and review papers available freely through university repositories or summaries; useful for grounding strategy changes in established behavioral findings. Who it’s best for: Analysts and advanced traders building systemic risk controls.
Organize resources by type with short descriptions, cost, and who it's best for
| Resource | Type | Cost | Best for |
|---|---|---|---|
| Trading in the Zone | Book | $15–$25 (paperback) | Traders needing consistency |
| Behavioral Finance for Traders | Course | $49–$199 (platform-dependent) | Busy learners seeking structure |
| Trading Journal | App | Free tier; premium from ~$5/month | Active traders tracking performance |
| Pre-trade checklist | Template | Free | Traders needing disciplined entries |
| Loss aversion studies | Research paper | Free / open access summaries | Quant/behavioral researchers |
This selection balances quick wins (free checklist, journal tracking) with deeper investments (book and course). The practical path: start with the pre-trade checklist and a free journal to build habits, then layer in the book for mindset work and a course for structured theory.
When choosing, match time availability and budget to the resource format: templates for immediate behavior change, books for conceptual depth, and courses for guided practice. These choices lead to measurable improvements in discipline and risk control without overcomplication.
Conclusion and Next Steps
Start small and make progress visible. Over the next 90 days the goal is to turn plans into repeatable habits: a clearly defined trading routine, objective risk checks, and a rhythm of review that surfaces behaviour patterns in your equity curve. Focus on measurable changes — fewer impulsive entries, tighter position sizing, and disciplined stop placement — rather than chasing perfect signals.
Practical milestones and how to measure progress
- 30-day focus: Build routine and baseline metrics — journal every trade, track win rate and average risk per trade.
- 60-day focus: Introduce process controls — position-sizing rules, pre-market checklist, and a simple edge test (e.g., backtest over 100 trades).
- 90-day focus: Consolidate improvements — optimize the strategy where data supports it, stabilize drawdown tolerance, and set a trading cadence that matches personal psychology.
- Define your objective metric (e.g., reduce average loss per trade to X% of equity).
- Choose two behavioural metrics to monitor weekly (e.g., adherence to stop-loss, number of discretionary overrides).
- Run a simple statistical check every 30 days to see whether changes are meaningful.
Practical tips for iteration and coaching
- Be ruthless with data: Use
equity_curvesnapshots and trade logs to spot repeating mistakes. - Treat coaching as leverage: A coach shortens the feedback loop by pointing out blind spots in execution and mindset.
- Iterate fast: Make one rule change at a time and test it for at least 30 trades before declaring it effective.
Map actions to timeframes, expected results, and review metrics for 30/60/90 days
| Timeframe | Action | Expected Result | Review Metric |
|---|---|---|---|
| 30 days | Journal every trade; set position-size rule; daily pre-market checklist | Consistent routine; clear baseline performance | Number of trades journaled; adherence % to checklist |
| 60 days | Backtest core setup; implement stop discipline; weekly review meetings | Reduced average loss; evidence of edge | Win rate; avg risk/reward; backtest P&L vs live |
| 90 days | Consolidate rules; forward-test optimized settings; monthly performance report | Stable equity growth; fewer behavioural leaks | Monthly return; max drawdown; behavioral adherence |
| Ongoing review | Weekly micro-reviews; monthly statistical audits; quarterly strategy review | Continuous improvement loop; early issue detection | Trend in equity curve; rolling performance metrics |
| Escalation to coaching | Schedule targeted coaching for recurring issues | Faster behavioral change; third-party accountability | Coach feedback action items completed |
Key insight: A 30/60/90 plan forces manageable experiments and measurable progress. Use objective metrics to decide what to keep, adapt, or discard; coaching accelerates that learning when patterns repeat.
Keep the momentum: small, measurable changes compound. Stick to the rhythm, and the discipline will outlast the next market surprise.
Conclusion
You’ve seen how emotion—not strategy—often decides whether a trade becomes a win or a disaster: that tight stomach before moving a stop, the stubborn hope that keeps a loser alive, the false confidence after a streak. Build resilience by turning those moments into data points: keep a disciplined journal, predefine your stop and position size, and review trades against emotional triggers, not just P&L. Earlier examples—moving a stop too early and holding through a margin call—aren’t moral failures; they’re predictable patterns you can detect and change.
Start small and specific. Try these immediate actions: - Run a two-week emotional audit in your journal. - Create one psychology-first rule for entries/exits and stick to it for 30 trades. - Measure progress by tracking adherence, not just returns.
If questions crop up—how fast will habits shift, how to recover from a big mistake, what to do when markets feel overwhelming—treat them as experiments: test one adjustment at a time, use position sizing to buy calm, and rebuild confidence with repeatable micro-wins. For structured drills, strategy templates, and daily journaling tools, see the NairaFX trading guides. Commit to deliberate practice; the markets don’t change your psychology, but disciplined habits will.