
Why does a perfectly planned trade fall apart the moment a data release hits the tape? A clean setup can turn messy fast when economic indicators shift sentiment, widen spreads, and trigger stops that looked safe a minute earlier.
That is where risk management stops being theory and starts protecting actual capital.
A payroll number, inflation print, or central bank comment can change volatility faster than many charts can react.
The market rarely gives one clear signal either.
In April 2026, the Conference Board said the US Leading Economic Index rose 0.1%, yet its six- and twelve-month growth rates stayed negative.
That kind of mixed read is exactly why traders cannot treat macro data as background noise.
Good Forex trading strategies do not try to predict every headline.
They decide in advance how much to risk, where slippage matters, and which currency pairs may move together when the news breaks.
That is the difference between being surprised by volatility and having a plan for it.
Quick Answer: Use economic indicators to adjust your order plan—not to predict direction. Think in three moves: Before the release: – Assign an “impact level” (high/medium/low) based on the indicator category (rates/inflation vs employment/PMI). – Check execution conditions first: expected spread behavior and whether your entry would land in the thinnest part of the window. – Decide: either reduce size/stop distance now, or wait for quotes to normalize. During the release: – Treat spikes and gaps as execution risk, not a signal. Prefer limit orders (or no new orders) if spreads widen. – If your setup is already open, cap damage: hold exposure constant or reduce it; don’t add on the first move.
After the release: – Label the result: Was it a surprise vs expectations, a revision, or an already-priced theme? – Update your rule for next time (e.g., “same indicator + same window conditions = smaller size / wider buffer / wait for stabilization”).
Why economic indicators matter for risk management in Forex
A central bank surprise can move a pair in seconds, but the real damage usually starts earlier, when traders ignore the calendar. Economic indicators tell us when pressure is building, when volatility may spike, and when a calm market is about to get noisy.
The useful part is not the headline itself.
It is the market condition hiding behind it.
A rising U.S. Leading Economic Index in April 2026 was only 0.1%, yet The Conference Board still noted negative six- and twelve-month growth rates, which is a good reminder that one upbeat print can sit inside a weak trend. The Conference Board’s latest leading indicators update and USAFacts’ explanation of leading, coincident, and lagging indicators both make the same point in different ways: indicators help traders separate noise from regime change.
That matters because Forex risk is not just about direction.
It is about slippage, stop placement, and position size when liquidity thins out around releases.
Our risk framework treats the calendar as a risk map, not just a trade watchlist, because that is where many “good” setups turn messy.
> The BIS notes that the global FX market is enormous and constantly active, with turnover measured in the trillions, so even small changes in expectations can ripple fast across major pairs. BIS Quarterly Review analysis on FX market turnover
- Leading indicators hint at future pressure. If they weaken, traders often cut size or widen their risk buffer before the move arrives.
- Coincident indicators show the current state. A firm print, like the Conference Board’s
0.3%rise in the CEI for April 2026, can support trend trades but still demand tight control.
- Inflation and labor data shape rate expectations. April 2026 U.S. unemployment at
4.3%and inflation at3.8%were enough to keep rate sensitivity high. USAFacts’ April 2026 economic indicator data
- Release timing changes execution risk. Stops that looked fine an hour earlier can get slipped badly during thin liquidity windows.
Traders who treat economic indicators as risk inputs make better decisions than traders chasing headlines.
They size smaller before major releases, protect correlated exposure, and wait for spreads to settle before pressing the next setup.
That discipline turns Forex trading strategies into something sturdier than guesswork.
The key indicators we should watch and what each one signals
Why does one rate decision jolt a pair for days while a GDP print barely gets a shrug? Markets do not price the last headline.
They price the next surprise, and that is why interest rates and inflation carry so much weight in Forex trading strategies.
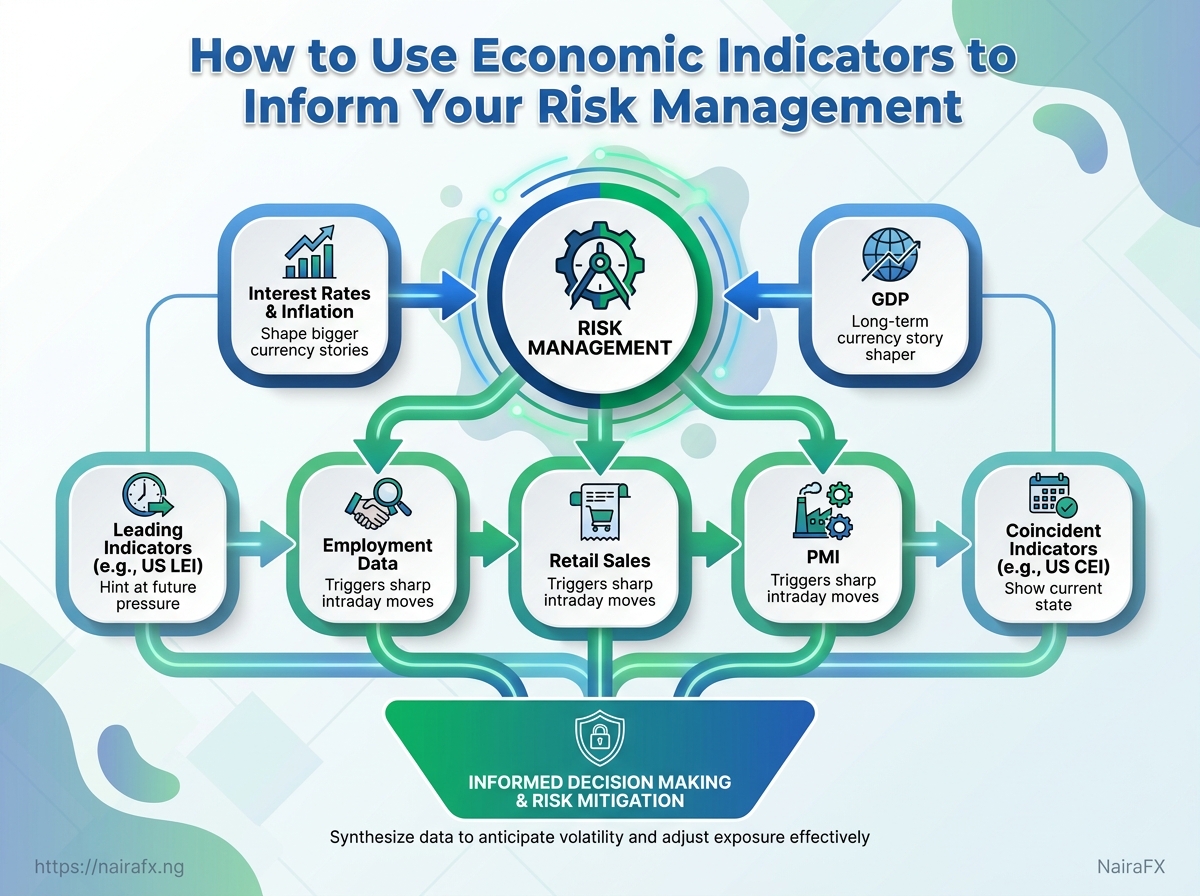
The smarter way to read economic indicators is to split them by speed. Interest rates, inflation, and GDP shape the bigger currency story, while employment data, retail sales, and PMI can hit much faster and trigger sharp intraday moves.
The Conference Board’s April 2026 update is a useful reminder: the US LEI rose 0.1%, yet its six- and twelve-month growth rates were still negative, while the CEI rose 0.3% to 115.6 The Conference Board April 2026 leading indicators update.
USAFacts also groups indicators into leading, coincident, and lagging buckets, which is a clean way to think about timing risk USAFacts explanation of economic indicators.
Reading the core signals
| Indicator | What It Measures | Typical Forex Impact | Risk Management Implication |
|---|---|---|---|
| Interest rates | Central bank borrowing cost | Can strengthen a currency and trigger sharp moves | Reduce position size ahead of major rate decisions |
| Inflation | Price growth in the economy | Can raise uncertainty and shift rate expectations | Widen stops if volatility is rising |
| GDP | Overall economic growth | Can support long-term currency sentiment | Use for broader bias, not short-term entries |
| Employment data | Labour market strength | Often moves markets quickly on release | Avoid overexposure during the announcement window |
Rates set the price of money, inflation changes how central banks think, and GDP tells you whether the economy is expanding or stalling.
The Conference Board’s 2026 GDP growth projection of 1.7% shows why GDP works better as a background guide than a scalp trigger The Conference Board April 2026 leading indicators update.
Fast-release data deserve extra care because they move on expectations and revisions, not just the headline number.
TradingEconomics keeps a live indicator list that includes GDP growth, interest rates, inflation, and unemployment, which is a good reminder that release timing matters as much as the data itself TradingEconomics indicators list.
The IMF’s World Economic Outlook gives the broader growth backdrop, which helps separate one noisy release from a real trend change IMF World Economic Outlook.
- Retail sales: Read them as a consumer-demand check. Strong spending can support a currency if traders start pricing firmer growth.
- PMI: Watch the new orders and employment parts first. They often turn before GDP does.
- Employment data: Treat the first minutes after release as execution risk. That is where slippage bites hardest.
Our risk management approach keeps that release window front and center, because a good idea can still get wrecked by bad entry timing.
The habit that pays is simple: separate slow-moving bias from fast-moving shock data.
That keeps Forex trading decisions calmer, cleaner, and a lot less expensive.
A clean indicator routine works best when it behaves like a checklist, not a prediction machine.
Before the trade, the job is to catch event risk early; during the trade, the job is to control damage; after the trade, the job is to learn whether the market agreed with the reading.
That matters because economic indicators are not all doing the same job.
USAFacts groups them into leading, coincident, and lagging types, while The Conference Board uses its indexes to spot turning points in the business cycle USAFacts’ explanation of economic indicators The Conference Board’s US leading indicators page.
Before the trade
The smartest pre-trade move is boring: check the calendar, then decide whether the setup still deserves your money.
Our risk framework treats the calendar as a risk filter, because event timing changes stop placement, slippage, and the size you can safely carry Naira Forex Trading’s risk management guide.
That is where volatility belongs in the decision.
If the expected swing is large, a fixed stop can be too tight, and a normal-sized position can become oversized very quickly.
- Check release timing: Avoid new entries just before a major print unless the setup already allows for wider noise.
- Compare volatility to your stop: If the stop is inside recent
ATRmovement, the trade may be too cramped. - Match size to risk: Keep the trade inside your planned risk-per-trade range, not your mood.
During the trade
Once price starts moving, the indicator is no longer a prediction tool.
It becomes a reference point for whether the market is behaving normally or telling you to get smaller.
This is where exposure matters.
If spreads widen or price whips around the release, hold risk steady or reduce it; do not add just because the headline looks friendly BIS Quarterly Review on FX market turnover.
- Widen or respect the stop: Let the market breathe if the original thesis still holds.
- Hold total exposure in check: Keep combined open risk under a preset cap.
- Scale only on confirmation: Add size only after the move proves itself, not on the first spike.
After the trade
The post-trade review is where indicator trading gets better.
Instead of asking whether the release was “good” or “bad,” ask what the market actually priced.
- Record what moved the price: Did it react to the headline, the revision, or the forecast gap?
- Check follow-through: A sharp first move that fades quickly usually signals the market didn’t accept the new information.
- Update the rule: If the same setup repeatedly fails after similar releases, your entry logic (or your event-window risk allowance) needs adjusting.
Used this way, economic indicators stop being noisy headlines and start becoming inputs to repeatable Forex risk decisions.
Why do some indicator releases feel twice as violent when naira pressure is already in the background? Because the trade is often getting hit from two sides at once.
A local currency can be under strain while global data pushes the dollar (or shifts risk sentiment) in the same direction.
In that setup, one headline is not the whole story.
When local demand conditions and global macro repricing reinforce each other, the chart can move faster than your plan expects—especially around releases where liquidity thins.
Reading the market, not just the headline
The cleanest way to read economic indicators in a volatile week is to ask whether the market is already stressed.
If it is, even a routine release can turn into a messy move.
USAFacts notes that indicators are used to judge current conditions and forecast what may come next, while the IMF’s World Economic Outlook shows how broader policy expectations can shift the tone for risk across currencies.
That matters for Nigerian traders because price reacts to context, not isolated numbers.
A pair tied to the dollar can respond differently when US inflation is firm, global growth is shaky, and local currency demand is already heavy.
When execution gets ugly, the quote becomes part of the signal.
The BIS tracks the FX market because liquidity is massive, fast-moving, and not always evenly available across sessions, especially during stress.
See the BIS Quarterly Review on global FX market turnover and the 2025 Triennial Central Bank Survey.
- Check whether both forces agree: Local naira pressure and global dollar strength can stack in the same direction.
- Watch spreads before entries: A widening spread often means the tradable price is worse than the screen price.
- Respect thin liquidity: If quotes are jumpy, small size beats heroic size.
- Treat gaps as danger flags: A gap can skip a stop and distort the trade’s real risk.
When spreads blow out or price gaps appear, size down first, then wait for normal quoting to return.
Market orders during stressed releases are usually expensive, and that cost shows up fast in slippage.
That is why we treat economic calendars and liquidity windows as execution risks in our risk management guide.
In volatile conditions, the smartest read is often simple: if the market is already tense, protect the trade setup before it protects you.
Common mistakes traders make when using economic indicators
Economic indicators only help when you translate them into what risk changes next—execution risk, not fortune-telling.
The three traps that keep showing up
- Trading the headline, not the setup.
- Ignoring surprise and market positioning.
- Treating every release as a new entry.
A Nigerian execution check you should do every time
Before you place or add risk around a major data print, confirm:- Spreads: if the spread is already stretched, your stop distance and slippage estimate must be adjusted.
- Liquidity window: avoid entries right at the most volatile moment (when quotes can jump).
- Naira vs global drivers: if local naira pressure and global dollar strength both point the same way, assume the move can be faster—and plan for wider execution noise.
A better habit is simple: compare forecast vs actual, check whether the move is one-off vs trend, and only then decide whether to manage risk or stay flat.
Building a repeatable indicator-based risk routine
Why do some traders stay calm while everyone else starts clicking around like the screen owes them money? Usually because they treat economic indicators as part of a routine, not a prediction contest.
A good routine keeps the decision small and the process steady.
That matters when the data mix is messy, which is most of the time.
In April 2026, the US Leading Economic Index rose just 0.1% to 97.4 after a 0.6% drop in March, while its six- and twelve-month growth rates were still negative; the Coincident Economic Index rose 0.3% to 115.6 in the same month, which is exactly the kind of split signal that should change risk size before it changes conviction.
The Conference Board’s data is a nice reminder that leading and coincident signals often point in different directions at the same time. The Conference Board’s leading indicators page and USAFacts’ guide to economic indicators both frame these categories clearly.
The routine gets easier when the same steps happen every time.
That includes checking the calendar, checking liquidity, checking size, and checking your own recent behavior before the order goes in.
NairaFX’s risk guide also points out that economic calendars and liquidity windows affect stop placement and slippage, which is the part many traders only notice after the damage is done.
Naira Forex Trading’s risk management strategies guide is built around that exact habit.
Before the order goes live
A calm entry starts before the chart does anything dramatic.
The job is to turn indicator risk into a fixed sequence.
- Check the release window.
- Classify the signal.
- Set the risk cap first.
- Adjust for execution risk.
- Check correlated exposure.
After the trade closes
The journal matters more than the victory lap.
A trader who only records entries and exits misses the real lesson, which is how the market punished or rewarded the setup under event pressure.
A simple review note should answer three things: did the indicator actually change your read, did execution distort the result, and did your position size match the volatility on the day? That last point pairs well with a Monte Carlo-style stress check, since NairaFX explains that reshuffling historical outcomes can reveal tail risk and probability of ruin better than a single backtest path.
Naira Forex Trading’s Monte Carlo simulation basics is a useful reference for that way of thinking.
A few clean journal prompts keep the review honest:
- Was the trade thesis wrong, or just the timing?
- Did the stop reflect the event, or the hope?
- Would I take the same size again?
That rhythm keeps indicator trading from turning into guesswork.
It also makes the next release easier to handle, because the process stays the same even when the market does not.
Trading the Release, Not the Guess
The real lesson is that economic indicators are not fortune-telling devices; they are risk signals.
A CPI print, an NFP surprise, or a central bank comment can change spreads, liquidity, and sentiment in seconds, which is why a solid setup can still fail if the trade has no room for noise.
That matters even more for Nigerian traders dealing with fast-moving conditions and thin liquidity at certain times.
A trader who sizes down before a major release, places stops with breathing space, and accepts that the first reaction may be messy is already thinking like a professional, not a gambler.
The habit worth keeping is simple: treat every major release like a stress test for your plan. Before your next trade, choose one upcoming data event, write down the possible market reaction, and set your maximum loss before the candle prints. If you want a sturdier framework, our risk management notes and Forex trading strategies are built around exactly that kind of discipline.