


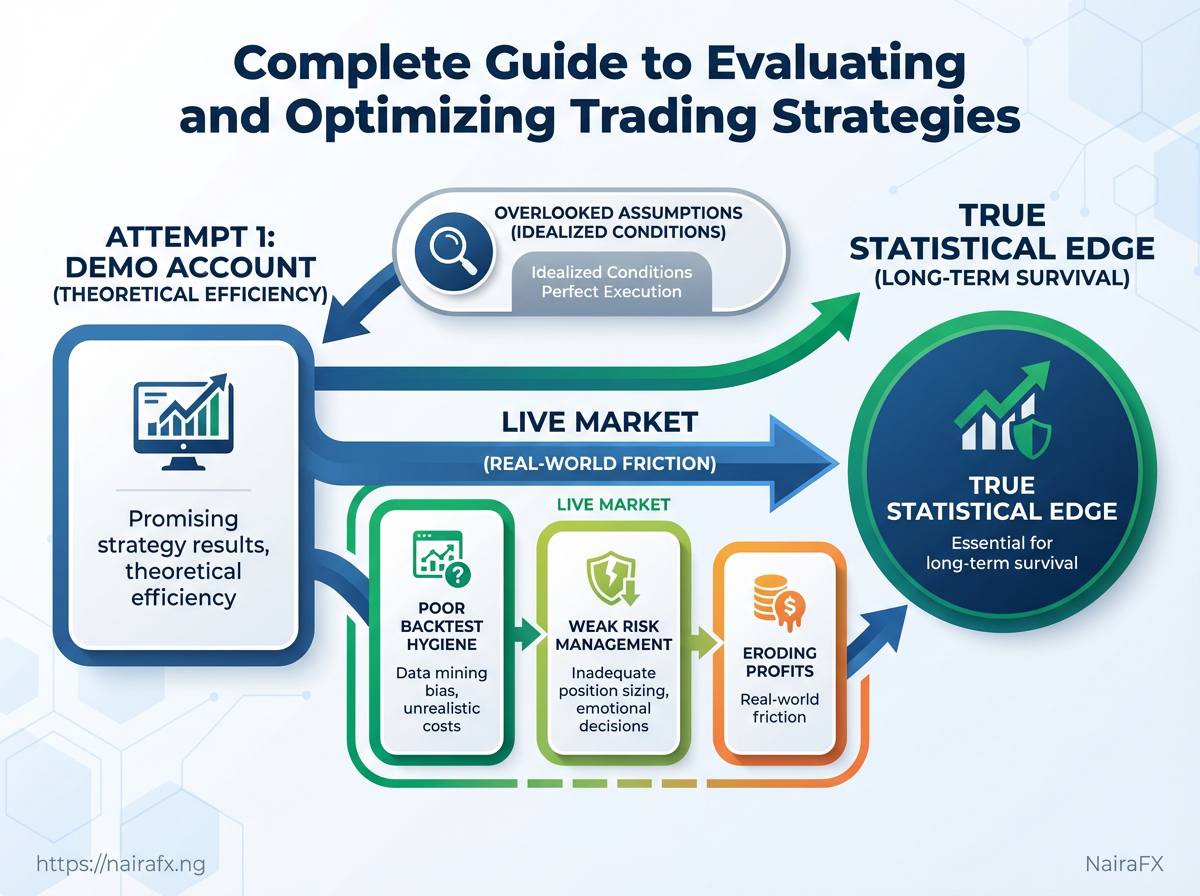
Most traders recognise the pattern: a promising strategy posts great results on demo accounts, then erodes quickly in live markets when slippage and emotional choices enter the picture. The gap between paper profits and real money comes from overlooked assumptions, poor backtest hygiene, and weak risk management, not from luck or market magic. Fixing that gap starts with precise measurement and ruthless pruning of what doesn’t survive real conditions.
Think about the last time a system’s win rate looked reliable until one big loss wiped several winners; that reveals the absence of a true statistical edge, not merely an execution problem. Evaluating a system means treating it like a product — quantify performance drivers, stress-test under stressed market regimes, and only keep rules that improve robustness. The following material translates those tasks into concrete checks and practical adjustments traders can apply immediately to reduce drawdowns and preserve capital.
Executive Summary
This guide gives a concise, actionable snapshot for improving trading performance in volatile Nigerian markets. It focuses on measurable outcomes—expectancy, drawdown, Sharpe/Sortino ratios, win rate and trade frequency—then shows how to raise those metrics through practical optimization: parameter tuning, risk allocation, and regime-aware filters. Expect concrete deliverables: a checklist, a one-page cheat sheet, and links to tools and simulations that stress-test strategies under realistic local conditions.
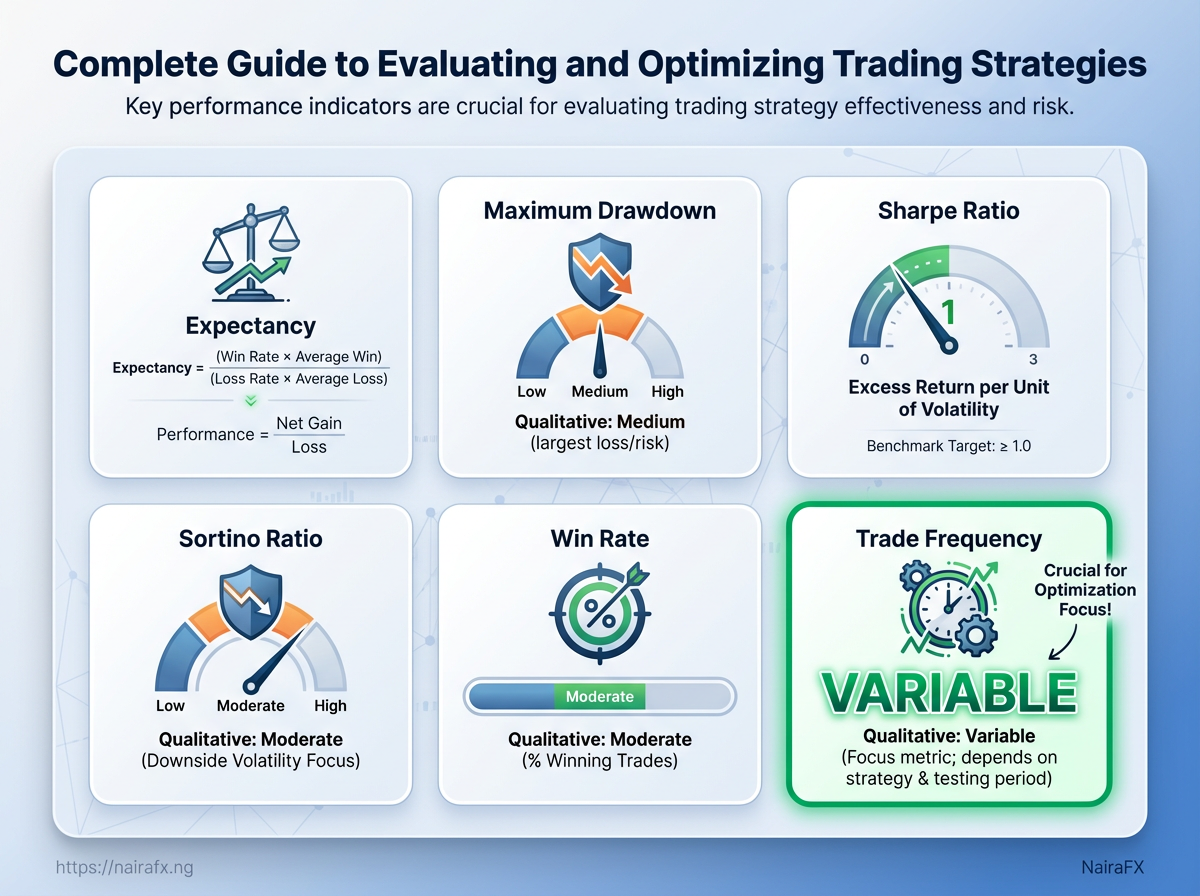
Industry-relevant performance definitions used throughout the guide:
Expectancy: Average net return per trade; Expectancy = (Avg Win Win Rate) - (Avg Loss Loss Rate).
Maximum Drawdown: Largest peak-to-trough equity decline observed, used to size position limits and stop rules.
Sharpe Ratio: Risk-adjusted return measured as excess return per unit volatility.
Sortino Ratio: Variant of Sharpe focusing on downside volatility only.
Win Rate: Percentage of trades that close profitably.
Trade Frequency: Average number of trades per time unit (day/week/month), affecting slippage and commission estimates.
Core areas covered, in practical terms:
- Performance diagnostics: How to compute and interpret the metrics above, and common pitfalls when sample sizes are small.
- Optimization approaches: Parameter grid searches, walk-forward testing, and Monte Carlo simulation to assess robustness.
- Risk allocation tactics: Position-sizing by volatility, Kelly fraction considerations, and portfolio-level constraints.
- Regime filters: Simple macro indicators, volatility regimes, and liquidity checks that reduce false signals.
Step-by-step improvement workflow:
- Backtest with realistic costs and
slippageassumptions. - Run walk-forward optimization and record out-of-sample performance.
- Perform Monte Carlo simulations to estimate probable equity curve scenarios.
- Apply regime filters and re-evaluate risk-adjusted returns.
Deliverables included with the guide:
- Checklist: Pre-launch readiness and monitoring items.
- Cheat sheet: Quick formulas and parameter ranges.
- Resource links: Simulation tools, data providers, and risk calculators.
NairaFX’s services—Monte Carlo simulation, long-term forex strategy support, and equity-curve risk evaluation—fit naturally into the workflow above for traders wanting deeper stress-testing. This section equips a trader to move from vague confidence to quantified readiness, with clear next steps for validating and deploying strategies in real markets.
How to Define Objective and Success Criteria
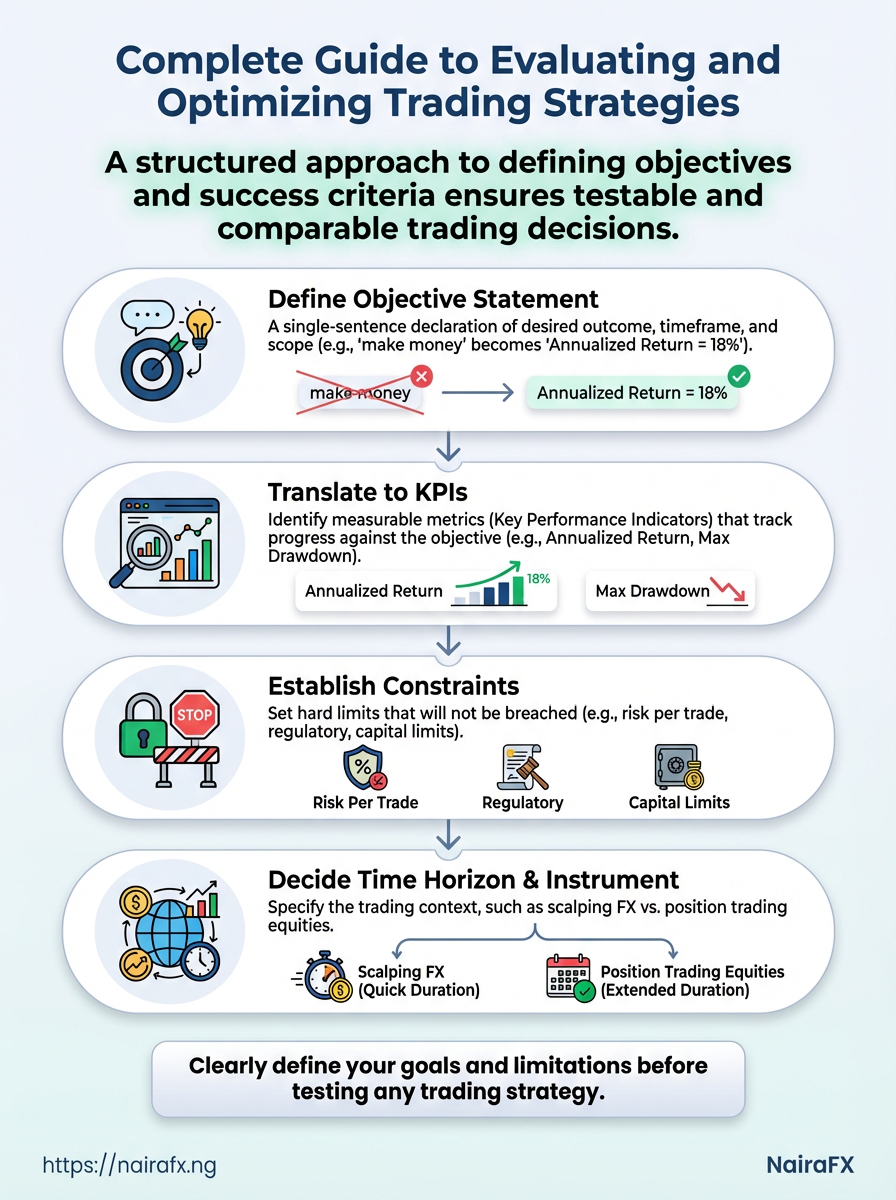
Define a clear objective first: a concise statement of what the trading approach must achieve, for whom, and over what horizon. Then translate that objective into measurable KPIs and binding constraints so decisions are testable and comparable. A vague aim like “make money” becomes actionable when specified as Annualized Return = 18% with Max Drawdown ≤ 8% and a timeframe of 12 months.
Objective: A single-sentence declaration of desired outcome, timeframe, and scope. KPI: A measurable metric used to track progress against the objective. Constraint: A hard limit you will not breach (e.g., risk per trade, regulatory, capital).
Practical steps to convert goals into KPIs and constraints:
1. Decide the time horizon and instrument (scalping FX vs. position trading equities).
2. Choose primary KPIs that map directly to investor priorities: return, risk, and operational capacity.
3. Set secondary KPIs to capture quality and sustainability: Sharpe, expectancy, average trade duration.
4. Define absolute constraints: maximum tolerated drawdown, maximum leverage, capital allocation per trade.
5. Document acceptance criteria for live deployment (e.g., backtest vs. live slippage thresholds).
Common KPI choices and what they control: Expectancy: average net result per trade; controls edge and position sizing. Max Drawdown: limits tail risk and psychological failure. Annualized Return: aligns with investor return targets and compounding assumptions. Win Rate: helps set realistic trade filtering and cost expectations. * Average Trade Duration: matches strategy to capital liquidity needs.
KPI targets for scalper, swing trader, and position trader to guide goal-setting
| KPI | Scalper – Example Target | Swing Trader – Example Target | Position Trader – Example Target |
|---|---|---|---|
| Expectancy (per trade) | 0.5% | 1.5% | 3–5% |
| Max Drawdown | 3–6% | 6–12% | 10–20% |
| Annualized Return | 20–60% | 25–50% | 12–25% |
| Win Rate | 55–70% | 45–60% | 40–55% |
| Average Trade Duration | minutes–hours | 2–14 days | weeks–months |
Key insight: Scalpers need tighter drawdown control and higher trade frequency to hit high annualized returns; swing traders balance frequency and per-trade edge; position traders accept longer duration and larger drawdowns in exchange for bigger per-trade gains. Choose KPIs that reflect the trader’s time availability, capital, and psychological tolerance.
When balancing return targets with drawdown limits, explicitly trade off one against the other rather than treating them as independent wishes—set the constraint, then tune position sizing and signal aggressiveness to meet both. Clear, testable success criteria make live decisions straightforward and reduce second-guessing when markets get noisy.
Designing a Robust Testing Plan
A credible testing plan starts with clean, realistic data and ends with validation that your strategy survives unknown market conditions. Backtests are useful only when they reflect execution realities: tick-level or properly aggregated data, realistic spreads and slippage, commissions, and corporate events. Avoid overfitting by using strict out-of-sample tests and walk-forward analysis so parameter tuning happens only on in-sample windows; then performance is evaluated on the next unseen window. Walk-forward mimics live adaptation and reveals whether apparent edge is robust or a curve-fit.
Core components of a robust plan
Clean, adjusted data: Use data with corporate actions, splits, and dividends applied; remove bad ticks and align timezones. Realistic execution costs: Model spreads, slippage, and commissions as distributions, not single constants. Out-of-sample discipline: Reserve contiguous OOS periods and never peek while optimizing. Walk-forward testing: Recalibrate on a rolling in-sample window, test on the following period, and aggregate results across many windows. Stress scenarios: Include regime shifts, liquidity drain, and increased volatility runs.
Practical steps for implementation
- Gather and prepare data.
- Clean tick or best-available bar data; apply corporate-action adjustments.
- Define execution cost model.
- Implement spread and slippage as
random_normal(mean, sd)or as percent-of-spread tied to volume. - Run walk-forward loops.
- Aggregate metrics: CAGR, Sharpe, max drawdown, and equity curve stability.
Modeling execution costs and avoiding overfitting
Model execution as a combination of fixed fees and market-impact that scales with order size. Use conservative assumptions: when uncertain, widen slippage and spread ranges. When optimizing parameters, limit free variables and prefer economic justification for each parameter. Monte Carlo resampling of fill outcomes helps estimate likely equity-curve dispersion; this is where Monte Carlo simulation for trading strategy enhancement can add value for longer-term position traders.
Walk-forward example
Set 24 months in-sample, 6 months out-of-sample, rolling by 6 months. Calibrate indicators in the 24-month window, test on the next 6 months, then roll forward. Record performance across at least 6–10 cycles to judge stability.
Checklist matrix of data and test elements required for credible backtests
| Element | Required? (Y/N) | Why it matters | Minimum recommendation |
|---|---|---|---|
| Tick vs aggregated data | Y | Captures spreads, order book effects | Use tick or 1s/1m bars for intraday; 5m+ for swing strategies |
| Spread/slippage modeling | Y | Affects realistic entry/exit P&L | Model as distribution; scale with volume |
| Commission and fees | Y | Reduces edge; essential for net returns | Include fixed + per-lot fees from broker schedules |
| Corporate actions / market events | Y | Prevents artificial returns from splits/dividends | Apply adjustments and remove bad ticks |
| Out-of-sample / walk-forward split | Y | Guards against overfitting | Rolling 12–36m IS with 3–12m OOS windows, multiple cycles |
The checklist highlights that every credible backtest needs data quality, cost modeling, and strict OOS discipline; without all three, reported edge is likely overstated.
Keeping testing honest is a habit: build tests that would fail under realistic frictions and only trust strategies that still perform across many walk-forward slices and conservative cost assumptions.
Key Quantitative Metrics and Interpretation
Quantitative metrics turn gut feel into actionable assessments. Traders who quantify performance see which parts of a system actually work and which are dragging returns — not guesses, but measurable signals. Below are the core metrics every strategy should report, what healthy values typically look like, and clear red flags that demand investigation.
Expectancy: Expectancy measures the average return per trade after wins and losses are combined. It’s the single-most-direct link to long-term profitability because it answers: on average, how much does a trade add (or subtract) from equity?
Sharpe Ratio: Sharpe evaluates return relative to total volatility using standard deviation. It’s best for strategies where upside and downside volatility matter equally.
Sortino Ratio: Sortino isolates downside volatility by using downside deviation rather than total deviation. Prefer this when upside volatility should not penalize a strategy (e.g., momentum systems).
Max Drawdown: Max drawdown is the largest peak-to-trough loss observed. It’s a practical measure of risk tolerance and capital endurance.
Win Rate: Win rate is the percentage of trades that close profitably. Alone it’s misleading; pair it with average win/loss size and expectancy.
Interpretation tips and red flags
- High expectancy, low trade frequency: Acceptable if backed by robust sample size; if sample size <200 trades, treat with caution.
- Sharpe >> Sortino: Suggests upside volatility dominates; check if large winners skew Sharpe.
- Sortino significantly higher than Sharpe: This is often desirable — the system captures large upswings while controlling downside.
- Max Drawdown exceeds planned risk: Stop and re-evaluate position sizing and correlation risk.
- High win rate with negative expectancy: Classic red flag — winning small, losing large. Rework R:R or exit rules.
Side-by-side definitions and healthy/concern ranges for core metrics
| Metric | Definition | Healthy Range | What to watch for |
|---|---|---|---|
| Expectancy | Average net return per trade (wins & losses combined) | > 0.02 (2%) per trade for active strategies; positive otherwise | Negative expectancy despite high win rate — check R:R and outliers |
| Sharpe Ratio | Return minus risk-free divided by total standard deviation | > 1.0 good; > 2.0 excellent | Inflated by fat-tailed returns or low trade count |
| Sortino Ratio | Return minus target divided by downside deviation | > 1.5 desirable; > 2.5 strong | Low Sortino vs Sharpe indicates downside risk concentration |
| Max Drawdown | Largest historical peak-to-trough percent decline | < 20% for retail equity; adjust to account size | Drawdowns lasting >12 months or exceeding risk plan |
| Win Rate | Percentage of profitable trades | Varies widely; 40–60% common | High win rate with poor expectancy — exit sizing problem |
Analysis: Expectancy links directly to compounding — small positive expectancy repeated wins in the long run. Sharpe and Sortino answer different questions: Sharpe for overall volatility, Sortino for downside protection. Max drawdown sets realistic recovery horizons and capital needs. Win rate must always be contextualized with average win/loss size.
Quantify these regularly and let the numbers prompt specific changes — position sizing, stop rules, or signal filters — rather than guesses. That’s how a strategy transitions from hopeful to repeatable.
📝 Test Your Knowledge
Take this quick quiz to reinforce what you’ve learned.
Optimization: Techniques and Pitfalls
Optimizing a trading strategy isn’t about squeezing every last tick of backtest P&L out of parameters; it’s about finding stable rules that survive market shifts. Start with simpler rules and fewer parameters, verify robustness through walk-forward testing and Monte Carlo simulation, and always justify parameter choices with economic logic rather than curve-fit performance alone. When those three habits are followed, live performance tends to be more predictable and drawdowns more manageable.
Why simplicity matters: complex models with dozens of tunable variables look great in-sample but are much more likely to exploit noise. Keep the parameter set minimal, prefer integer or round-number thresholds where they make sense, and anchor choices to observable market behavior (volatility regimes, session timing, liquidity windows).
Safe tuning practices Limit parameters: Use the smallest set required to capture the edge. Prefer robust rules: Choose rules whose performance varies smoothly across nearby parameter values. * Validate economically: Ensure rules map to a real market mechanism (e.g., mean-reversion in low-volatility markets).
Safe tuning and robustness checks
| Technique | Complexity | Overfit Risk | Recommended When |
|---|---|---|---|
| Manual parameter sweep | Low | Low–Medium | Quick sanity checks; small parameter spaces |
| Grid search with CV | Medium | Medium | Structured search for few parameters; use cross-validation folds |
| Genetic algorithms | High | High | Exploratory search over large spaces; risk of hidden overfit |
| Bayesian optimization | High | Medium | Efficient search when evaluations are costly; pair with validation sets |
| Regularization methods | Medium | Low | Reduce overfitting in parameter-rich models; include penalty terms |
Key insight: Manual sweeps and regularization prioritize interpretability and lower overfit risk; genetic and Bayesian methods can find stronger in-sample fits but require strict out-of-sample validation such as walk-forward or Monte Carlo to be trusted.
Walk-forward process (step-by-step) 1. Define an initial in-sample window and an out-of-sample window.
- Optimize parameters on the in-sample window.
- Test those parameters on the immediately following out-of-sample window and record performance.
- Slide the windows forward and repeat to form a sequence of out-of-sample results.
- Aggregate results to assess stability and distribution of returns.
Monte Carlo robustness checks add another layer: randomize trade order, tweak fills, and stress transaction costs to see how sensitive performance is to realistic perturbations. If small perturbations flip profit to loss frequently, the strategy needs simplification or stronger economic grounding.
Definitions
Walk-forward testing: Rolling optimization and validation that simulates a live re-optimization cadence.
Monte Carlo simulation: Randomized resampling of trades or returns to estimate strategy performance dispersion under varied conditions.
Avoid the temptation to optimize on identical data slices and then boast of peak returns. Robustness means surviving reasonable changes in assumptions and still delivering the intended exposure. Keep models simple enough to explain, and the live account will respond with fewer surprises.
Risk Management and Position Sizing
Position sizing is the engine that turns a profitable edge into consistent returns. Get sizing wrong and even a high-win-rate system will blow up; get it right and small edges compound reliably despite noise. The practical goal: match risk per trade to account volatility, instrument characteristics, and macro stress scenarios so that drawdowns stay survivable and your decision-making stays rational.
Sizing methods that work in practice
Fixed fractional: Risk a constant percent of equity per trade (e.g., 1% of account). Simple, scales with equity, and limits ruin risk.
Volatility-based sizing: Scale position by ATR or volatility so that position risk (in Naira or USD) equals target risk. Works well across forex, equities and futures because it normalises different volatilities.
Kelly-adjusted: Use Kelly to compute an optimal fraction, then shrink (e.g., 0.25–0.5 * Kelly) to reduce variance. Powerful but sensitive to estimation error.
Equal-dollar exposure: Use for non-directional or portfolio strategies where each position has equal capital allocation rather than equal risk.
Risk parity / correlation-aware sizing: Adjust position size for correlation to the portfolio so concentrated bets don’t create hidden tail risk.
Stress scenarios and why to run them
Stress testing finds tail events that normal backtests miss. Always simulate:
- Historical shocks (e.g., 2016 Naira float, 2020 COVID FX moves)
Run Monte Carlo resamples of trade sequences to see the distribution of possible drawdowns and time-to-recovery under different sizing rules. This reveals how often a given sizing causes >30% drawdown or long drawdown tails.
Practical examples
Example — Forex pair with ATR-sizing: Target 0.5% equity risk. ATR = 0.0100 on a 100k Naira account → position sized so stop-loss = ATR and loss = 0.5k Naira.
Example — Portfolio correlation adjustment: Two long positions in the same sector: reduce each size by 30% relative to standalone sizing to keep portfolio volatility within limits.
NairaFX’s Monte Carlo simulation for trading strategy enhancement can quickly quantify tail probabilities for different sizing choices and stress scenarios, which is especially useful in volatile Nigerian markets.
Sizing preserves the trading edge by keeping drawdowns manageable and behaviourally sustainable. Pick a method that fits the instrument, stress-test it against realistic shocks, and prefer modest, demonstrable survival over aggressive theoretical returns.
Implementation and Monitoring Framework
A practical implementation and monitoring framework turns strategy plans into disciplined, observable systems so small deviations are caught early and fixes are reproducible. Start with a monitoring dashboard that surfaces performance, risk and execution metrics in near real-time, and pair that with a strict change-control process so any code/config update is tracked, reviewed and reversible.
Core monitoring features Live PnL feed: feed from execution logs updated intraday. Risk heatmap: consolidated view of exposures per instrument and portfolio. Alerting engine: threshold and anomaly alerts via SMS, email or webhook. Audit trail: timestamped records of deployments, parameter changes and dataset versions. * Reconciliation view: broker fills vs. internal expected fills.
Recommended monitoring metrics with frequency and alert thresholds
| Metric | Report Frequency | Suggested Threshold | Action When Breached |
|---|---|---|---|
| Daily PnL | Daily | Loss > 2% of strategy AUM | Pause new trades; investigate recent fills and model drift |
| 7-day rolling Sharpe | Daily | Sharpe < 0.4 | Re-run performance attribution; check signal degradation |
| Max Drawdown (since deploy) | Daily | Drawdown > 8% | Halt increases in position sizing; convene review |
| Average Slippage | Daily | Slippage > 0.15% per trade | Validate execution algorithms; notify broker |
| Trade Execution Latency | Intraday (1-min) | Median > 250 ms | Switch to backup route; examine network and colocated gateways |
Data sources: trading platform logs, broker reports, internal execution systems.
Market teams should configure automated alerts so breaches trigger an assigned owner and a required response window.
Change-control and reproducibility aren’t optional. Treat strategy code, parameter sets, and data snapshots like production software.
- Commit code to
gitwith descriptive messages and feature branches. - Tag releases with semantic versioning and snapshot data used in backtests.
- Run CI/CD pipelines that include unit tests, integration tests against staging fills, and automated backtest summaries.
- Require peer review and approval for any change that alters risk controls or execution logic.
- Maintain an immutable change log that records deployer, timestamp, diff, and roll-back instructions.
Operational tips: store data snapshots with checksums, keep a lightweight docker image for reproducible runtime, and enforce access controls for deployment keys. Use automated canary deployments to expose changes to a small portion of flow before full rollout.
A dashboard plus disciplined change-control turns an ad-hoc trading setup into a repeatable, auditable system — that’s what keeps small issues from becoming catastrophic and makes every adjustment traceable.
Quick Reference and Cheat Sheet
Fast diagnostics and a compact set of formulas to test, tune, and sanity‑check any trading strategy quickly. Keep this page printable and pinned — run these checks before risking real capital.
One‑page checklist (run in under 15 minutes)
- Strategy sanity: Verify logic, entry/exit rules, and timeframe consistency.
- Data integrity: Confirm no look‑ahead, correct timezone alignment, and clean price feeds.
- Trade count: Ensure ≥100 independent trades (or sufficient Monte Carlo runs) for statistical confidence.
- Win/loss balance: Check that a single trade or cluster doesn’t dominate returns.
- Drawdown behavior: Identify max drawdown and recovery time under realistic slippage.
- Position sizing: Validate that sizing plan keeps ruin probability acceptably low.
- Execution realism: Simulate spreads, commissions, and realistic fills.
Top optimization & robustness checks
- Run a walk‑forward test with at least 3 non‑overlapping in‑sample/out‑of‑sample splits.
- Perform Monte Carlo reshuffles of trade sequence to estimate return distribution under stress.
- Apply parameter sensitivity sweeps: vary core parameters ±20% and record performance stability.
- Test across multiple market regimes (trending, mean‑reverting, high/low volatility).
- Validate on out‑of‑market data (different instruments or correlated pairs).
Essential formulas (quick paste for spreadsheet or script)
Return on Trade: R = (ExitPrice - EntryPrice) / EntryPrice (use signed for shorts)
Profit Factor: PF = GrossProfit / GrossLoss
Sharpe Ratio (annualized): SR = (MeanDailyReturn 252) / (StdDevDailyReturn sqrt(252))
Sortino Ratio (annualized): Sortino = (MeanDailyReturn 252) / (DownsideStdDev sqrt(252))
Kelly Fraction (fractional Kelly advisory): K = (W - (1 - W) / R), where W = win rate, R = average win / average loss
Expected Value per Trade: EV = W AvgWin + (1 - W) AvgLoss
Position Size (risk per trade): Size = (AccountSize RiskPct) / (StopDistance ValuePerPoint)
Quick examples and notes
Example: If win rate = 0.45, avg win = 2R, avg loss = -1R → EV = 0.452 + 0.55(-1) = 0.35R (positive expectancy). Practical tip: If Monte Carlo shows >25% probability of extended drawdown beyond your comfort, reduce position sizing or tighten strategy rules. * Execution warning: Strategies that look great on tickless data often fail under realistic fills and slippage.
Keeping this cheat sheet next to your backtest environment turns hesitation into fast, data‑driven choices — practical, quick, and built for live trading discipline.
📥 Download: Trading Strategy Evaluation and Optimization Checklist (PDF)
FAQ
Most traders wrestle with the same practical worries: is my model learning noise, how much capital do I need, and how often should I trade? The answers below focus on actionable checks—use data, control for overfitting, budget for real costs, and pick a cadence that matches your edge.
What if my backtest looks perfect—how do I know it’s not overfitted? – Out-of-sample testing: Reserve a time-based or event-based holdout and only evaluate on that after development. – Walk-forward or Monte Carlo stress tests: Randomize trade order, slippage, and returns to see how fragile results are. – Simplify: Prefer fewer parameters; if a small tweak moves performance a lot, it’s probably overfitting.
How much capital should I start with? – Risk-based sizing: Size positions so a sequence of plausible losses doesn’t blow the account; many pros target risking 0.5–2% per trade. – Costs buffer: Include commissions, spreads, and occasional margin costs; start with extra capital equivalent to 1–3 months of expected drawdown.
How often should I execute trades (cadence)? – Match cadence to edge: If signals persist days–weeks, don’t force intraday trades. – Operational cost check: Higher frequency increases transaction costs and monitoring overhead. – Practical rule: Trade as often as the signal offers a statistically significant advantage after costs.
Which costs are most often underestimated? – Execution costs: Slippage and spread impact smaller accounts proportionally more. – Opportunity cost: Time spent monitoring low-edge strategies. – Data costs: Clean historical data and reliable tick feeds can add up.
How do I measure strategy robustness? – Parameter sensitivity: Check performance when tweaking key parameters. – Scenario testing: Simulate market shocks, different volatility regimes, and liquidity squeezes. – Equity-curve analysis: Look for clustering of returns or sudden concentration in a few trades.
When should I scale a working strategy? 1. Validate across multiple instruments or timeframes. 2. Re-run Monte Carlo simulations with larger capital assumptions. 3. Increase size gradually while monitoring slippage and execution.
For traders in Nigeria, consider running Monte Carlo evaluations and equity-curve reviews early; these are core services at NairaFX that align with local market realities and cost structures. Use these checks routinely—small habits prevent big mistakes, and consistent testing keeps an edge real.
Resources and Tools
Practical, reliable tools are what separate ideas from repeatable trading outcomes. Below are data sources, platforms, and reading recommendations structured so a Nigerian trader can pick a low-cost entry point, scale to professional workflows, and validate strategies with real historical ticks and risk analytics.
Quick reference of recommended tools, cost, and primary use-case
| Resource | Type | Free/Paid | Primary Use |
|---|---|---|---|
| Dukascopy Historical Data | Historical FX tick data | Free download | High-resolution FX tick & minute data for backtesting |
| TrueFX | Historical FX tick data | Free (registration) | Consolidated interbank tick data useful for spread-aware testing |
| HistData.com | Historical FX data | Free | Easy CSV downloads for quick strategy prototyping |
| MetaTrader 4 / 5 | Backtesting platform | Free / Broker dependent | Bar/backtest engine, strategy tester for EAs, broad broker support |
| TradingView | Charting + backtesting | Free tier / Paid plans ($14–$60+/mo) | Pine Script strategies, fast visual iteration, social ideas |
| QuantConnect | Quant research & backtesting | Free tier / Paid cloud compute | Lean engine, multi-asset, supports Python/C# and live trading |
| Backtrader | Backtesting framework | Open-source (Free) | Python-based, flexible order/commission modeling, local control |
| Portfolio Visualizer | Portfolio & risk analytics | Free tier / Paid features | Monte Carlo, drawdown, factor regressions, asset allocation testing |
| Power BI | Analytics/BI dashboard | Free desktop / Paid Pro | Build interactive dashboards from trade logs and market feeds |
| Google Looker Studio | Analytics dashboard | Free | Quick visualizations for trade logs via Google Sheets connector |
| Riskalyze | Risk assessment | Paid | Investor risk scores, scenario testing for portfolio risk alignment |
| Essential reading: Market Microstructure & Strategy | Books/papers | Paid / Free (papers) | “Algorithmic Trading” books, academic papers on market microstructure |
Industry analysis shows a practical stack combines accessible data, a flexible backtester, and a dependable analytics layer. Start with free historical tick data (Dukascopy/TrueFX), prototype strategies in TradingView or Backtrader, and use Portfolio Visualizer or Power BI to stress-test equity curves and run Monte Carlo scenarios.
Free entry-level path to try right away: Download tick samples from Dukascopy. Prototype logic in TradingView Pine Script or Backtrader. * Upload trade history to Portfolio Visualizer for Monte Carlo and drawdown analysis.
These resources make it realistic to design, validate, and scale trading strategies without expensive infrastructure — then selectively add paid services as the edge and capital justify them.
Conclusion
This piece pulled apart why promising demo results often fall apart live: unchecked slippage, incomplete success criteria, and emotional sizing decisions. Keep focused on defining objective metrics up front, running a disciplined testing plan that includes slippage and execution costs, and treating position sizing and drawdown rules as non-negotiable parts of the strategy. Earlier examples showed a trend-following system that looked flawless on historical backtests but lost edge once spread and latency were included, and a small mean-reversion tester that turned profitable once position-sizing rules were tightened — those contrasts show how much implementation details change outcomes.
Move from theory to action with three concrete moves: – Re-run your top strategies with realistic execution assumptions, including slippage and commission. – Lock down a monitoring dashboard and weekly review routine to catch behavioural drift. – Adopt strict position-sizing and stop rules before scaling live capital.
If you want professional help translating these steps into a repeatable workflow, services like NairaFX offer implementation support and risk-management tools tailored for Nigerian traders. Expect to answer practical questions — how many live trades prove an edge, what drawdown is tolerable — and use those answers to set clear go/no-go criteria. Take the next trading session to implement one of the three actions above; small, disciplined changes compound faster than chasing the next “perfect” system.