
When the market is noisy and the naira starts moving fast, charts can feel like a puzzle with missing pieces.
That is usually when traders hunt for forex indicators that promise cleaner entries and fewer bad guesses.
The problem is simple: a signal on its own rarely tells the full story. Technical indicators in forex work best when they confirm price action, not when they try to replace it.
That matters even more for Nigerian traders, where spreads, volatility, and sudden news can turn a decent setup into a messy trade.
A moving average, RSI, or MACD can help, but only if the trader knows what each one is really saying.
Too many people treat trading signals like magic arrows.
The smarter approach is to read the chart with context, stay patient, and use indicators as tools rather than instructions.
Why Forex Indicators Matter for Nigerian Traders
Forex indicators are not magic, but they do save traders from guessing.
In fast-moving markets, that matters a lot.
A clean moving average, RSI reading, or ATR reading can turn a messy price chart into something readable.
That matters even more for Nigerian traders, where volatility can show up fast.
The naira can react sharply to policy news, dollar demand, and global risk sentiment, so a chart that looks calm at noon can look different by evening.
Technical indicators in forex help filter some of that noise and make trading signals easier to compare.
They also help with discipline.
A trader who waits for confirmation from price action and indicators is usually less likely to jump at every candle spike.
That does not guarantee a winning trade, but it often cuts down on emotional entries that get punished in choppy markets.
Trend tools like moving averages help spot direction.
They are useful when price keeps drifting higher or lower instead of moving cleanly.
Momentum tools like RSI or MACD help judge strength.
They can show when a move looks tired, especially after a sharp push.
Volatility tools like ATR help size risk better.
They matter when spreads widen and price swings get messy.
Nigeria’s market conditions make signal quality tricky.
A good setup on a quiet session can fail during a news burst, a thin-liquidity period, or a broker execution delay.
That is why indicators work best as filters, not as blind commands.
A trader might see a bullish breakout, but still check volume, trend direction, and stop distance before acting.
That extra layer keeps the plan grounded.
It also helps separate a real move from a brief spike that disappears in minutes.
Indicators fit best when they sit inside a full trading plan.
Price action gives the context, indicators confirm the setup, risk rules define the loss limit, and execution decides the entry.
Without that structure, even the best signal can become an expensive guess.
Used well, forex indicators make trading less random and more repeatable.
For Nigerian traders dealing with sharp swings, that kind of structure is worth its weight.
Top Forex Indicators Every Trader Should Know
A trader staring at a noisy chart usually does not need more data.
They need cleaner signals.
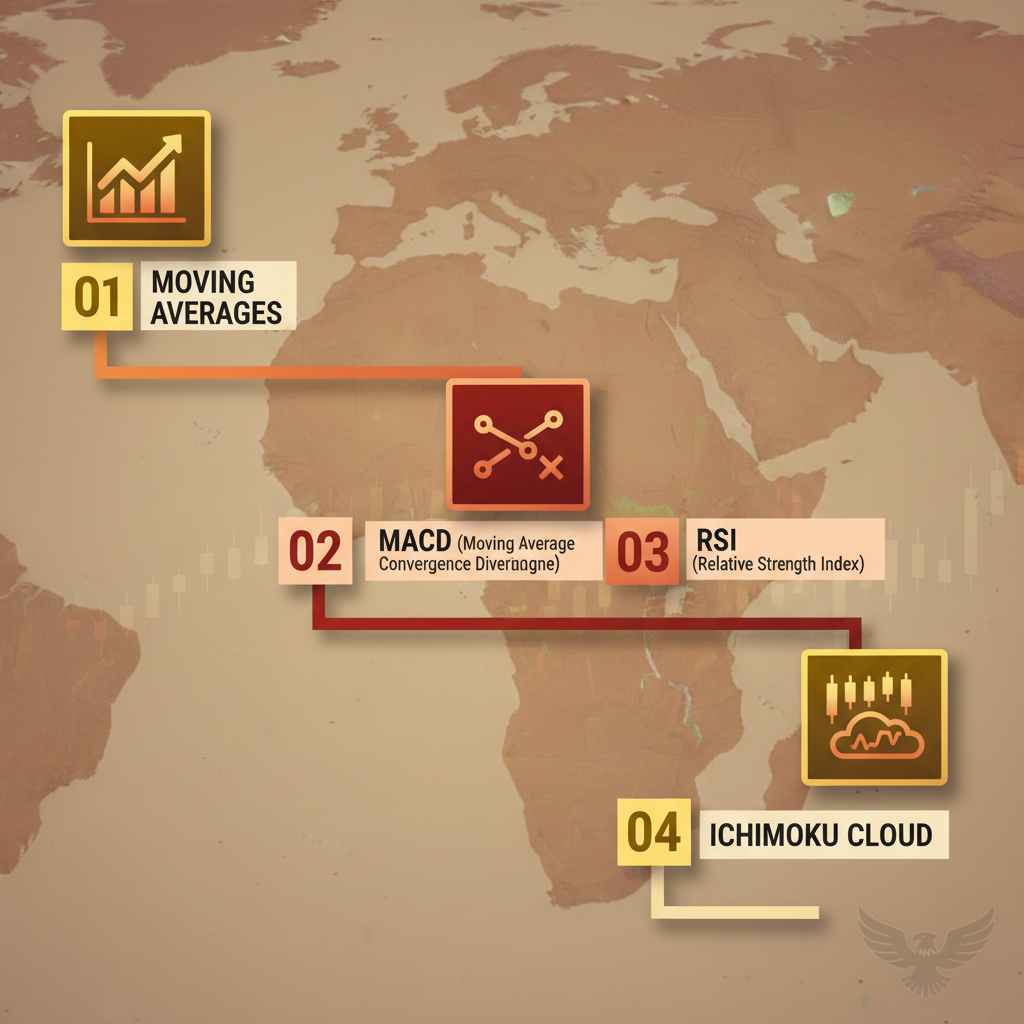
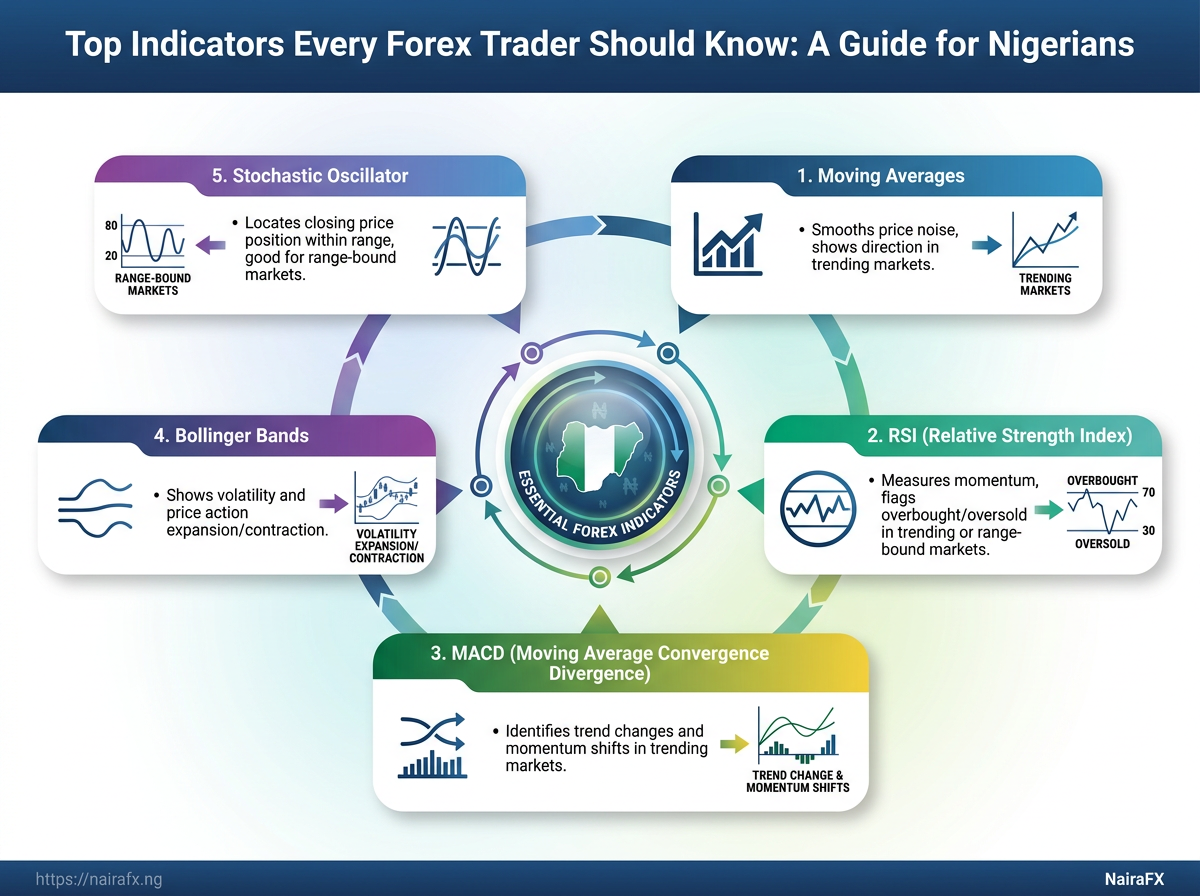
That is where the best forex indicators earn their keep. Moving Averages, RSI, MACD, Bollinger Bands, and the Stochastic Oscillator each answer a different question about price.
One shows direction.
Another shows momentum.
Another hints at volatility.
Used well, these technical indicators in forex stop charts from feeling like static and turn them into something readable.
Used badly, they become five confusing lines fighting for attention.
How the main forex indicators compare
| Indicator | What It Measures | Best Market Condition | Main Strength | Common Limitation |
|---|---|---|---|---|
| Moving Averages | Average price over a set period | Trending markets | Smooths price noise and shows direction clearly | Lags behind fast reversals |
| RSI | Momentum and overbought or oversold pressure | Trending or range-bound markets | Flags stretched moves and momentum shifts | Can stay extreme during strong trends |
| MACD | Trend change and momentum spread between moving averages | Trending markets | Helps spot trend shifts and momentum fade | Gives late signals in choppy markets |
| Bollinger Bands | Volatility around a moving average | Breakout or high-volatility periods | Shows expanding or contracting price action | False breakout signals in sideways markets |
| Stochastic Oscillator | Closing price position within recent range | Range-bound markets | Good for timing entries near support or resistance | Can produce many false signals in strong trends |
Some forex indicators are trend tools, while others are timing tools.
That matters because traders often expect one indicator to do everything.
It never does.
A moving average can keep you on the right side of a trend, but it will not time an exact entry as neatly as a Stochastic Oscillator.
RSI and MACD sit in the middle, giving momentum clues that often confirm whether a move has fuel or is starting to fade.
A practical setup is simple.
Use a moving average to define direction, then use RSI or Stochastic for timing, and let MACD or Bollinger Bands confirm whether momentum or volatility is changing.
That way, you are not reading five different trading signals at once.
You are stacking evidence.
For Nigerian traders, that kind of discipline matters even more when spreads widen or price jumps around news.
The cleaner the read, the less room there is for emotional trades.
Pick the indicator for the job, not the one that looks smartest on the screen.
That habit saves a lot of chart noise.
Trading Signals You Can Build with These Indicators
A strong signal is not a lone indicator blinking on a chart.
It is price, timing, and context agreeing with each other.
That matters because forex indicators can point in different directions at the same time.
A trend may still be healthy while momentum cools, and a reversal may start before the crowd notices.
Good trading signals use that tension instead of fighting it.
Trend-following signals
When price keeps respecting the same moving average, the market is usually telling you it still wants to travel in that direction.
These are the cleanest technical indicators in forex when you want direction, not drama.
A simple setup works well: the trend filter should point one way, and price should pull back without breaking structure.
That keeps you from chasing late candles.
Price above a rising average: Wait for a pullback to hold above the
50 EMA, then enter after a bullish close.Higher highs and higher lows: Use the indicator as a filter, not the trigger.
MACD above zero: It helps confirm the move still has room.
Momentum signals
Momentum signals are about timing, not just direction.
A market can trend for days and still offer bad entries if the push is already tired.
A cleaner approach is to look for a breakout, then ask whether the indicator agrees with the strength of that move.
If the push is real, momentum should expand instead of fading immediately.
RSI crosses 50: That often marks the shift from weak to stronger bullish pressure.
Fast candle after consolidation: It can show fresh participation after a quiet stretch.
MACD histogram widens: That often supports an entry after price clears a range.
Reversal signals
Reversal signals are the most tempting, and the easiest to get wrong.
They work best when price stretches too far and the indicator starts disagreeing with the move.
A classic warning sign is divergence.
Price makes a new high or low, but the indicator does not follow.
That gap often shows the move is running out of fuel.
Divergence at resistance or support: It can warn that a trend is tiring.
Failure swing on RSI: It often appears before a turn becomes obvious on price.
Price snaps back inside a band: That can show an overextended move losing grip.
A clean signal usually beats a clever one.
The best results often come from one trend cue, one momentum cue, and one exit rule working together.
How to Combine Indicators Without Overcomplicating Your Chart
A messy chart usually starts with good intentions.
One trader adds a trend tool, then a momentum tool, then three more because each one “looks useful.” Suddenly the chart says everything and nothing at once.
The cleaner approach is boring in the best way.
Pick indicators that answer different questions: Is the market trending? Is the move still strong? Is the entry timing decent? That keeps your forex indicators useful instead of noisy.
For Nigerian traders, that matters even more when spreads widen or price gets jumpy around news.
A chart with too many technical indicators in forex can make you hesitate on good setups and chase bad ones on bad days.
Simple pairs that work
The best pairs are not the fanciest ones.
They are the ones that do different jobs without stepping on each other.
Trend plus timing: A moving average for direction and RSI or stochastic for entry timing.
Trend plus volatility: A moving average and ATR, so you can see both direction and how wild the move is.
Structure plus momentum: Support and resistance with MACD or RSI, so price location and pressure agree.
How to stop signals from fighting each other
Conflicting signals usually mean the indicators are saying the same thing in different accents.
That happens when two tools measure momentum, or when one is too fast and the other too slow for the timeframe you trade.
The fix is simple.
Give each indicator a job, and ignore it outside that job.
If a trend filter says “uptrend,” then a momentum tool should only help with entry timing, not override the whole plan.
Choose one trend filter: For example, a moving average or price structure.
Choose one entry trigger: Use RSI, stochastic, or a candle close.
Choose one risk check: ATR, a recent swing, or fixed stop distance.
A basic three-step confirmation setup
Imagine a trader watching EUR/GBP on a 1-hour chart.
Price is above the 50-period moving average, so the trend leans upward.
Then price pulls back and RSI dips near the middle line instead of collapsing.
The entry comes only after a candle closes back above the pullback high.
That gives three clean checks: trend, timing, and confirmation.
Trend filter stays in your favor.
Momentum or oscillator resets instead of chasing the move.
Price closes in the trade direction before entry.
That kind of setup keeps the chart readable and the decision process calm.
Clean charts tend to make cleaner decisions, and that helps more than another blinking indicator ever will.
Which Indicators Work Best in Different Market Conditions
A clean moving average can look brilliant in a strong trend and useless during a sleepy sideways session.
That is the part many traders miss when they treat forex indicators like they behave the same everywhere.
Trending markets usually reward direction tools.
Range-bound markets punish them.
News spikes, meanwhile, can make even solid technical indicators in forex look late if the trader ignores volatility.
The smarter move is matching the tool to the market mood.
When the chart is pushing in one direction, you want indicators that confirm strength.
When price is trapped, you want tools that flag exhaustion and bounce zones.
Indicator choices by market condition
| Market Condition | Recommended Indicator | Why It Helps | Risk to Watch |
|---|---|---|---|
| Trending market | Moving Averages with ADX | The average shows direction, while ADX helps confirm whether the trend has enough strength to matter. | Late entries after the move is already stretched. |
| Range-bound market | RSI | RSI is useful when price keeps snapping between support and resistance, because it highlights overbought and oversold swings. | False signals when a range suddenly breaks. |
| High-volatility news period | ATR | ATR shows when movement expands, which helps with stop placement and position sizing before price gets erratic. | Sharp spikes can still jump past planned exits. |
| Low-liquidity session | Bollinger Bands | Bollinger Bands can help spot thin-market overextension, especially when price drifts and then snaps back. | Bands can stay tight for a long time and tempt early trades. |
In practice, trend tools work best when the market is already moving cleanly, while range tools earn their keep when price keeps bouncing between familiar levels.
News periods are different.
ATR becomes more useful there because it tells you when the market is breathing harder than usual, even before the candle close feels dramatic.
For low-liquidity sessions, the danger is not just low volume.
It is the fake sense of stability that can vanish the moment London or New York opens.
Pick the indicator based on that context, and the chart starts making more sense fast.
Common Mistakes Nigerian Traders Make with Indicators
A chart with five oscillators and three moving averages looks busy for a reason: it gives conflicting answers.
Many traders in Nigeria end up reading noise instead of structure, then wonder why the trade felt “valid” and still failed.
That usually happens when forex indicators are treated like a decision machine.
They are better at framing trading signals than predicting the next candle with certainty.
The harder mistake is emotional.
A trader sees a fresh signal during a fast market move, jumps in late, and ignores stop-loss placement because the setup “looks strong.”
Using too many indicators at once: A crowded chart often creates agreement by accident.
If three technical indicators in forex say different things, price still wins.
Treating indicators as perfect prediction tools: Indicators react to past price data.
They do not know about the next rejection, breakout failure, or sudden reversal.
Ignoring risk before entry: A signal without a
stop-lossis just hope with a chart attached.Good entries still fail, so trade size matters as much as direction.
Chasing signals during major news releases: Spreads can widen fast, and price can whip both ways in seconds.
A clean setup before news often becomes a mess after the release.
Changing rules after one loss: One losing trade does not mean the indicator is broken.
It usually means the trader expected certainty from a tool built for probability.
A simple example makes this obvious.
Imagine a trader buys EUR/USD just before a high-impact U.S. data release because RSI looks oversold and momentum looks strong.
The market spikes, pulls back hard, and the trade gets clipped before the idea even settles.
The better habit is boring, and that is exactly why it works.
Keep the chart readable, define risk first, and treat forex indicators as confirmation tools rather than crystal balls.
When traders respect that difference, their trading signals get cleaner and their account gets less battered by avoidable mistakes.
That discipline matters more than adding one more indicator ever will.
How to Test Indicators Before Using Them With Real Money
A moving average crossover can look brilliant on a clean chart and still bleed money in live trading.
That is why testing matters so much before any real cash goes in.
The safest path is simple: backtest the idea, press it through a demo account, then record every trade in a journal.
Those three steps show whether the forex indicators are actually producing usable trading signals or just looking clever on screen.
Backtest on old price charts
Backtesting is where the first hard truth shows up.
You scroll through past candles and check how the technical indicators in forex behaved across different conditions, not just the perfect ones.
Look for at least one full trend, one choppy range, and one sharp reversal.
If an indicator only works in one of those settings, it is not ready for real money.
A clean test keeps the rules fixed:
Use one setup. Decide exactly which indicator, timeframe, and entry rule you are testing.
Mark every trade. Write down the entry, stop, exit, and reason.
Count the outcome. Note wins, losses, and break-even trades without cherry-picking.
Move to a demo account next
A demo account adds one thing backtests cannot: pressure.
Price moves in real time, spreads change, and your patience gets tested.
That matters because many forex indicators look fine on historical charts but feel awkward when candles are printing live.
A demo run shows whether you can follow the rules without second-guessing every signal.
Treat the demo account like real money.
Use the same lot size, the same risk limit, and the same trading hours you plan to use later.
Keep a trade journal
A trade journal turns scattered attempts into something readable.
It shows whether a setup fails because the indicator is weak, or because the execution was sloppy.
For each trade, record the pair, timeframe, indicator settings, entry reason, exit reason, and result.
Add one short note on your mood too, because hesitation and revenge trading leave fingerprints.
At NairaFX, we like this part because it exposes patterns fast.
After 20 to 30 logged trades, the story usually becomes obvious: some setups deserve confidence, and others deserve the bin.
A tested indicator is far more useful than a pretty one.
Real money should only meet a signal after it has already survived past charts, demo trades, and your own notes.
Choosing the Right Indicators for Your Trading Style
A scalper watching a 1-minute chart does not need the same tools as a swing trader holding positions for days.
The real job of forex indicators is not to look impressive; it is to fit the speed of the decision in front of you.
That mismatch causes a lot of trouble.
A fast chart can turn even good technical indicators in forex into noise, while a slower chart can make a trader react too late if the setup is built for quick entries.
Scalpers: keep it fast and lean
Scalpers live inside tiny windows, so speed matters more than depth.
One trend filter and one timing tool are usually enough, because every extra line adds delay.
On very short time frames, the best indicator choice is often the one that helps you avoid hesitation.
A scalper in London or New York session conditions needs a setup that answers one question quickly: is momentum still alive, or already fading?
Day traders: balance timing with context
Day traders usually have a bit more room to breathe.
That makes it possible to use indicators that confirm direction without forcing rushed entries.
A cleaner pairing works best here.
One indicator can show trend direction, while another helps judge whether price has stretched too far during the session.
Swing traders: slow signals win more often
Swing traders should think in hours and days, not minutes.
That means the indicators need to filter out market chatter and keep focus on the broader move.
A slower setup tends to suit this style better because it ignores the false urgency that kills patience.
The goal is not more signals.
It is better-quality ones.
Scalpers: Use the smallest set that still gives a clear entry and exit plan.
Day traders: Match indicators to session pace and avoid overreacting to every candle.
Swing traders: Favor slower tools that hold up across multiple sessions.
Any style: If the chart feels crowded, the setup is probably working against you.
A simple rule helps here.
If you cannot explain your setup in one sentence, it is probably too heavy for your style.
A good indicator choice should feel natural, not forced.
When the setup matches your time frame, the chart becomes easier to read and the trade becomes easier to manage.
Conclusion
Fewer Indicators, Cleaner Decisions
If your chart feels noisy, pause before adding another tool. Build a compact, rules-based setup you can execute consistently—then validate it with backtesting, demo trading, and a trade journal.
Use one simple framework:
- Trend lens: choose one trend reference (e.g., a moving average or clear price structure) on your chosen timeframe.
- Entry trigger: choose one timing condition (e.g., RSI or Stochastic) that matches your plan.
- Risk guard: define stop logic using a volatility measure (e.g., ATR) or a recent swing point.
- Confirmation + execution: act only on candle close/your confirmation rule—especially when spreads and volatility spike in Nigeria.
Next step: test the exact rules, run them with the same risk sizing on a demo, and log outcomes separately for calmer vs. more volatile sessions. The goal is not more signals—it’s a repeatable decision process you can trust.