

You open your trading platform and a single candle erases half your day’s gains — or worse, triggers a margin call. That heart-sinking moment shows that risk management is not just a theory. It actually determines if your account survives or disappears.
Risk goes beyond just stop-losses. It also includes position size, how markets are related, and the rules you follow when under pressure. Tight position sizing keeps one bad trade from wrecking a week, while smart stop-loss placement protects against sudden, irrational market moves without turning every fluctuation into a loss.
Traders who make money consistently view risk as a system, not just luck. They learn to measure exposure, set simple limits for when markets are volatile, and tell the difference between necessary risks and reckless hopes. These distinctions can change outcomes.
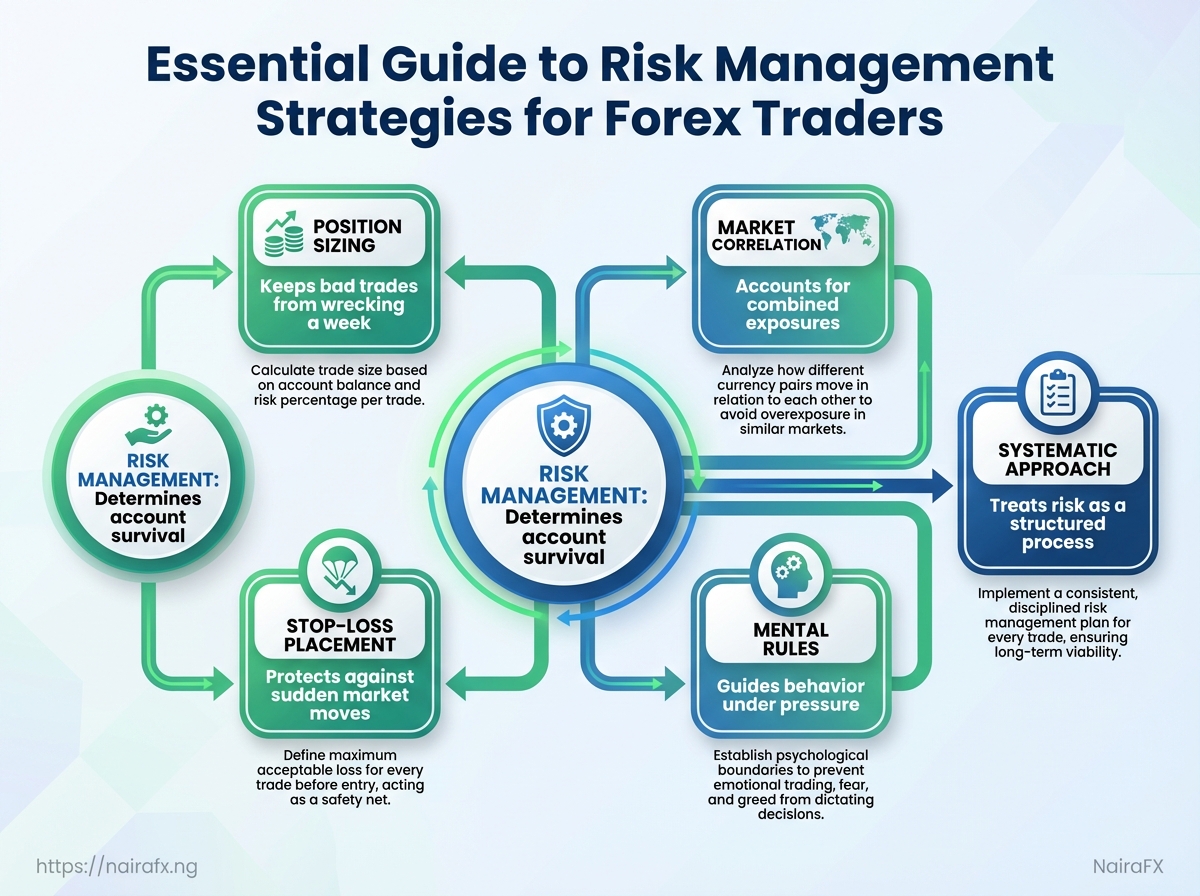
Core Principles of Forex Risk Management
Your top priority should be capital preservation—protect your account so you…
Core Principles of Forex Risk Management
Preserving capital should be your main priority. Protect your account so you can trade tomorrow. That mindset changes how trades are sized, where stops are placed, and how portfolio exposure is managed. Effective risk management makes uncertainty a controlled process, not a guessing game.
Capital preservation: Treat the trading account as a business asset; avoid drawdowns that require recovery beyond realistic performance. Keeping drawdowns small preserves psychological edge and avoids the compounding drag of large losses.
risk_percent. 2.
risk_amount = account_size
Convert risk_amount into position size using stop distance and pip value. 10 50 = $10`.
Position sizing formulas and examples: Use position sizing to translate a monetary risk into contract size.
pip_value) is a compact, reproducible calculation for spot FX. position_size = risk_amount / (stop_distance_in_pips
Accounting for correlation and portfolio risk: Sum exposures across correlated pairs; avoid accidental concentration.
- If long EUR/USD and long GBP/USD, portfolio exposure to USD direction is similar — treat them as partially correlated rather than independent.
- Use simple correlation matrices or convert positions into a common risk unit (dollars at risk) to ensure total portfolio risk stays within limits.
Practical operational rules:
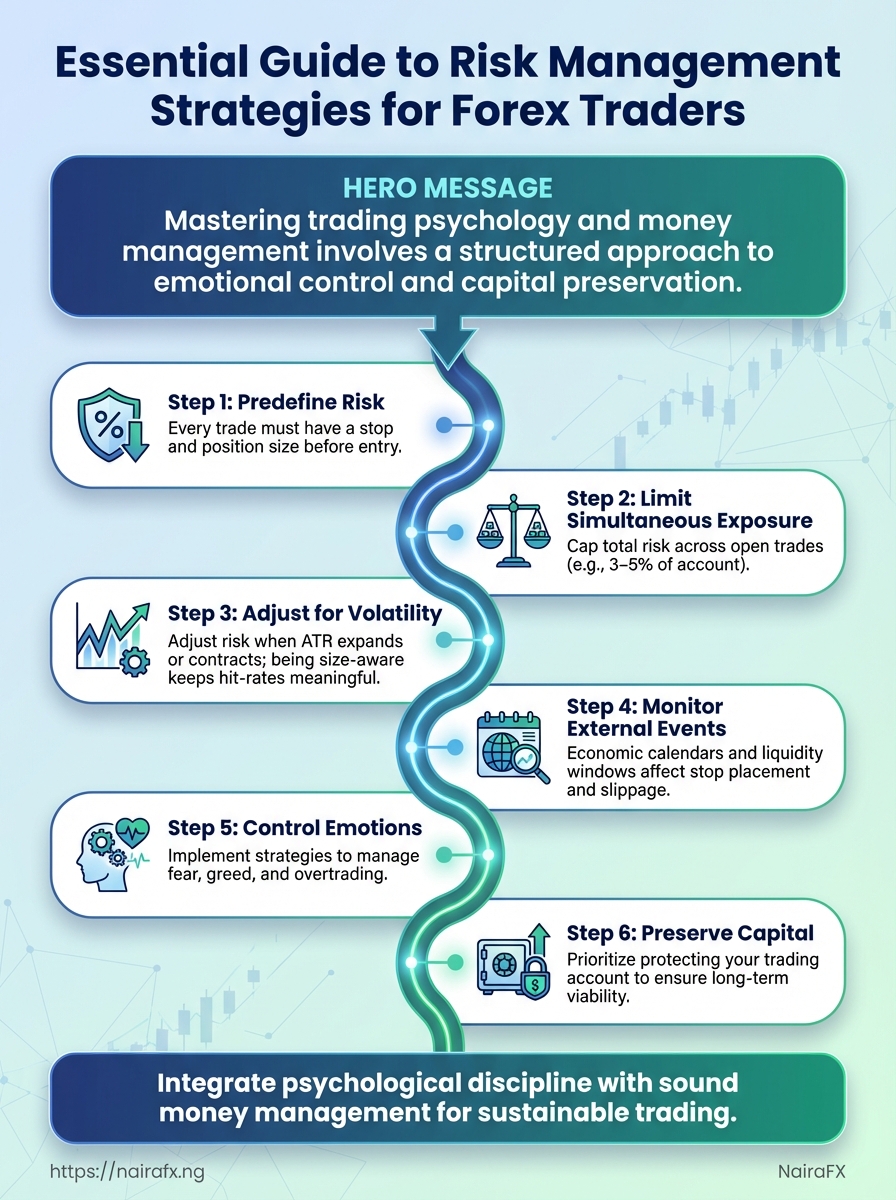
- Predefine risk: Every trade must have a stop and position size before entry., 3–5% of an account is a common guideline.). Use volatility: Adjust risk when ATR expands or contracts; being size-aware keeps hit-rates meaningful.
- Monitor skew and events: Economic calendars and liquidity windows affect stop placement and slippage.
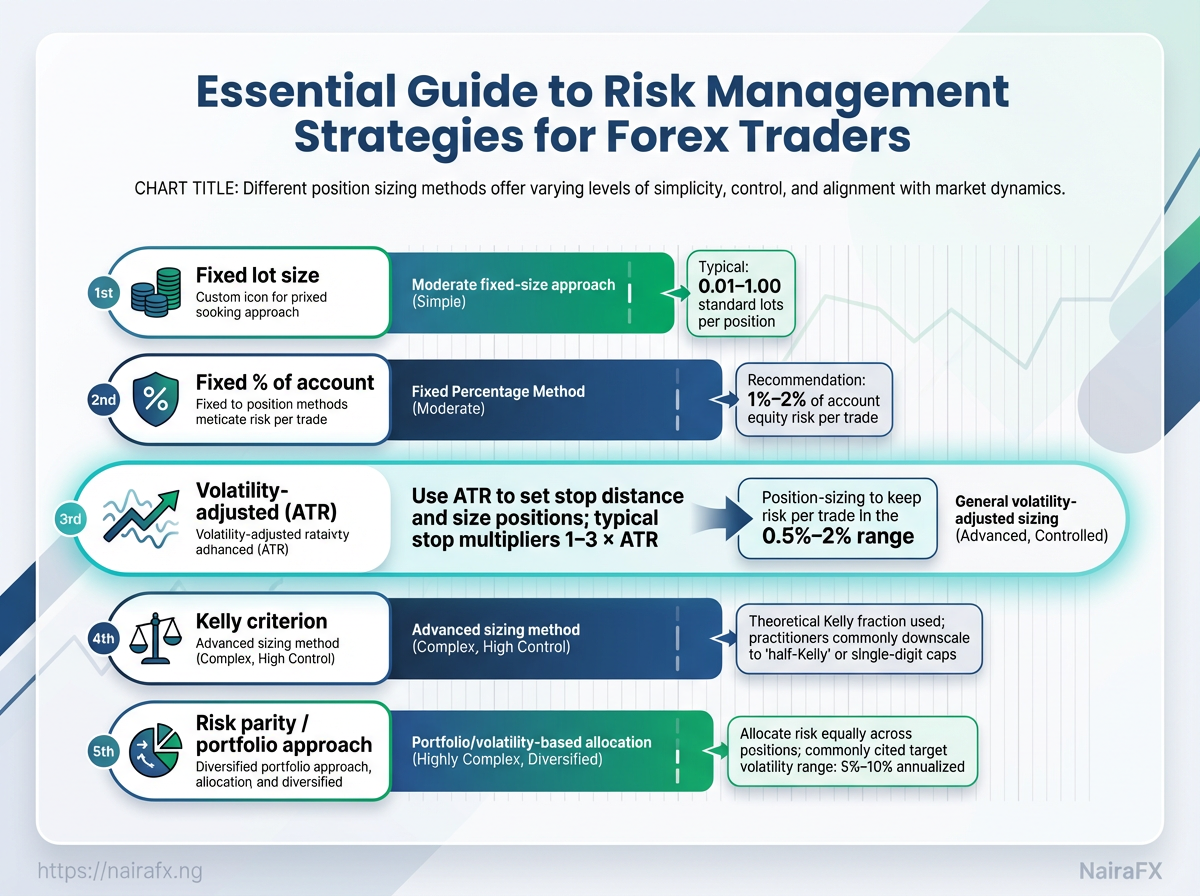
Common risk-per-trade rules and position-sizing approaches (fixed lot, fixed percentage, volatility-adjusted) to show pros and cons
Table: Core Principles of Forex Risk Management — Method, How it works, Pros & more
| Method | How it works | Pros | Cons |
|---|---|---|---|
| Fixed lot size | Use same lot size every trade (e.g., 0.01 lots) | Simple, easy to execute | Ignores account growth or stop distance; risk % varies |
| Fixed % of account | Risk a set % of account on each trade (e.g., 1% of an account size of $1,000 is approximately $10.) | Scales with equity; controls downside | Requires stop-based sizing calculation each trade |
| Volatility-adjusted (ATR) | Set stop = k ATR; size so dollar risk = target risk | Aligns size with market noise; fewer whipsaws | Wider stops in volatile markets reduce position size significantly |
| Kelly criterion (conservative use) | Uses win-rate and RR to compute optimal fraction | Theoretically maximizes growth | Sensitive to estimate errors; often reduced (e.g., half-Kelly) |
| Risk parity / portfolio approach | Allocate risk equally across assets based on volatility | Balances portfolio-level risk | Requires correlations and volatility estimates; more complex |
Industry guides provide deeper worked examples and templates — see the Investopedia overview of stop-loss usage and practical strategy pieces from AtlasFX. For step-by-step beginner explanations, check OnsaFX risk strategies.
Risk rules are the framework that keep trading repeatable and survivable. Apply them consistently, and the account will do the heavy lifting while decisions remain calm and deliberate.
Practical Techniques: Stop Losses, Take Profits, and Order Types
Placing effective stops and targets…
Practical Techniques: Stop Losses, Take Profits, and Order Types
To place effective stops and targets, you need specific rules and context. This includes technical structure, recent volatility, execution ability, and your trading edge. Use volatility-based stops when price noise is high, technical stops when structure matters, and automated order types to remove emotion and ensure consistent execution, especially around news.
How to place effective stops and targets
Fixed pip stop: Simple distance-based stop expressed in pips. Best for small, consistent timeframes or when volatility is low. 5×ATR or 2×ATR`).
Industry guides recommend ATR for adaptive sizing because it respects changing market noise Investopedia: Understanding Forex Risk Management. Support/resistance-based stop: Place stops beyond clear structural levels — below swing lows or above swing highs — to avoid being stopped out by normal retracements. Trailing stop (ATR/percentage): Moves stop in your favor using a fixed percentage or a multiple of ATR; protects profits while letting winners run.
Backtesting often shows trailing stops outperform fixed exits for trend strategies. Time-based stop: Exit after a predetermined time if price doesn’t move (useful for mean-reversion setups and options trades).
Order types and automation
- One-Cancels-the-Other (OCO): Place stop-loss and take-profit as linked orders so the filled side cancels the other automatically; ideal for preventing orphaned exits.
- Trailing stop orders: Broker-level trailing stops adjust with price — useful when not monitoring constantly. Confirm broker behavior for
trailing by pricevstrailing by ticks. - Limit vs market orders: Use
limitfor predictable entries,marketwhen execution certainty matters; expect slippage on markets with low liquidity.
Practical steps to implement
- Define trade idea and measure recent volatility (calculate ATR on the relevant timeframe).
- Convert acceptable risk (e.g., 1% of account) into position size using stop distance.
- Place OCO with stop and take-profit, or set a trailing stop once trade is in profit.
- On major news, consider reducing size or widening stops; expect slippage and partial fills.
> Market practice and broker documentation show slippage spikes during economic releases and low-liquidity windows.
Common pitfalls: Wider stops without size reduction, moving stops prematurely, and ignoring broker order quirks during news.
Common stop/take methods, ideal contexts, risk profile, and implementation difficulty
Table: Practical Techniques: Stop Losses, Take Profits, and Order Types — Method, Best used when, Risk profile & more
| Method | Best used when | Risk profile | Implementation complexity |
|---|---|---|---|
| Fixed pip stop | Stable, low-volatility pairs; scalps | Low to medium | Low |
| ATR-based stop | Variable volatility; swing/position trades | Medium (adaptive) | Medium |
| Support/resistance-based stop | Structure-driven setups, breakout trades | Medium (structural protection) | Medium |
| Trailing stop (ATR/percentage) | Trend-following strategies | Low-to-medium while trailing; protects profits | Medium |
| Time-based stop | Mean-reversion or time-sensitive plays | Low (caps exposure) | Low |
Using these building blocks — volatility-aware sizing, structural placement, and automated OCO/trailing orders — makes risk predictable and execution cleaner, which is what separates consistent trading from luck. Keep testing stop rules in backtests and demo before applying them live.
Portfolio-Level Risk: Correlation, Diversification, and Management
The correlation between…
Portfolio-Level Risk: Correlation, Diversification, and Management
The correlation between positions affects how risk accumulates in your portfolio. Holding three long positions that all move together is very different from three long positions that offset one another during stress. Traders should treat correlation coefficient as a first-order input to position sizing: it tells whether exposures compound or provide natural hedges.
For retail traders in Nigeria dealing with volatile FX and cross-asset movements, tracking correlation is the easiest way to prevent hidden concentration from damaging an account.
Why correlation matters for retail traders
- High positive correlation: Positions amplify drawdown risk when the market moves against the shared driver.
- High negative correlation: Offers natural diversification, but watch event-driven decoupling.
- Low correlation: Reduces tail risk if correlations remain stable, but correlations can spike in crises.
Correlation matrix: A grid of -1 to +1 values showing pairwise relationships. Use 30- and 90-day windows to spot regime shifts. According to Investopedia’s guide on forex risk management, stop-losses and defined risk only work if aggregated exposure is understood — correlation is how you measure that aggregation.
Simple diversification rules to reduce tail risk
- Limit same-driver exposure. Cap exposure to positions that share the same macro driver (e.g., commodity FX, risk-on currencies).
- Use time-window checks. Compare Comparing 30-day and 90-day correlations is a common practice.; widen protection when short-term correlation rises.
- Scale by effective exposure. Convert positions into a common risk metric (pip value or USD-equivalent delta) before summing.
Practical limits by account size
- For accounts under $1,000: keep effective ≤
5:1. - For $1,000–$10,000: keep effective ≤
10:1. - For >$10,000: a conservative range is
10:1–20:1, lower if using concentrated strategies.
interacts with correlation — two highly correlated positions at 10:1 create far greater tail risk than uncorrelated ones at the same.
Monitoring tools: correlation matrices and exposure reports
- Correlation matrices: Live heatmaps that show pairwise
correlation coefficients. - Exposure reports: Sum notional and delta across currencies and risk drivers.
- Monte Carlo simulations: Stress aggregated exposure under thousands of paths — a service like Monte Carlo simulation for trading strategy enhancement can make this practical during strategy reviews.
Provide a sample correlation table for major currency pairs and a short interpretation guide
Table: Portfolio-Level Risk: Correlation, Diversification, and Management — Pair, EUR/USD, GBP/USD & more
| Pair | EUR/USD | GBP/USD | USD/JPY | AUD/USD |
|---|---|---|---|---|
| EUR/USD | 1.00 | 0.85 | -0.60 | 0.65 |
| GBP/USD | 0.85 | 1.00 | -0.55 | 0.70 |
| USD/JPY | -0.60 | -0.55 | 1.00 | -0.40 |
| AUD/USD | 0.65 | 0.70 | -0.40 | 1.00 |
| Interpretation notes | EUR & GBP move together; treat them as a single exposure when sizing. | High EUR/GBP correlation raises concentration risk. | USD/JPY often moves opposite EUR/GBP; it can hedge some EUR/GBP risk. | AUD/USD clusters with commodity/risk-on moves; watch commodity data and China headlines. |
Good portfolio-level risk control starts with measuring how positions combine, then limiting and concentration based on that measurement — do that consistently and the occasional market shock stops being catastrophic.
Key Takeaway: Think of position sizing and checklists as safety rails—they don’t generate profits, but they prevent small mistakes from turning into major losses. A disciplined position-sizing routine, paired with simple risk calculators and a short trade…
Risk Controls: Position Sizing Tools, Risk Calculators, and Checklists
Think of position sizing and checklists as safety rails—they don’t generate profits, but they prevent small mistakes from turning into major losses. A disciplined position-sizing routine, paired with simple risk calculators and a short trade checklist, automates the discipline needed for surviving volatile Nigerian markets.
Position sizing: The process of converting a desired monetary risk into contract/lot size based on stop distance and account equity.
Risk per trade: The absolute amount of capital at stake if the stop-loss is hit.
Risk-to-reward (R:R): The ratio between potential profit and potential loss for a trade.
Practical use of a position sizing calculator
- Decide
risk_pctof account (common: 0.5–2%).
- Measure stop distance in pips or price.
- Apply
risk_per_trade = account_size risk_pct.
- Convert
risk_per_tradeinto lots using instrument-specific tick/pip value.
Example: For a ₦2,000,000 account and 1% risk, risk_per_trade = ₦20,000. With a stop 50 pips and pip value ₦200/lot, position = ₦20,000 / (₦200 50) = 2 lots.
Tools that speed this up
- Spreadsheet calculators: Simple, auditable, and easy to adapt to local currency. Web calculators: Fast conversions and instrument libraries — useful on mobile. Broker-integrated tools: Put orders sized correctly at order entry.
- Monte Carlo simulators: Stress-test position-sizing rules against equity curve variability; useful for sizing when volatility is non-stationary (this aligns with Monte Carlo services used for strategy enhancement).
A ready-to-use trade checklist
- Trading plan confirmed: Market context, timeframe, and thesis. Risk set: Risk percent and stop-loss distance calculated. Position size verified: Lot/contract size plugged into order ticket.
- Exit plan defined: Clear take-profit and rules for partial exits. * Emotional check: Calm, clear, no revenge or FOMO trading.
Daily/weekly risk-review routine
- Daily: Log entries/exits, actual risk taken vs planned, P/L, and deviations.
- Weekly: Aggregate max-drawdown, average risk per trade, win-rate, and adherence rate to the checklist.
- Monthly: Run a Monte Carlo stress test on the month’s equity curve to check ruin probabilities.
Trade logging to measure outcomes
- Essential fields: instrument, entry, stop, size, risk₽, outcome, notes.
- Analysis cadence: Filter by setup type and stop distance to spot systematic sizing mistakes.
Industry guides on risk controls are helpful for implementation; see the practical frameworks in Investopedia’s Forex risk management overview and a deeper strategy primer at AtlasFX’s guide to Forex risk management. Using calculators and checklists turns judgment into repeatable processes, which is the single most reliable way to keep small losses predictable and survivable.
Key Takeaway: Advanced hedging and volatility methods step in when plain stop-losses or position sizing no longer keep drawdowns inside acceptable bounds. , political events, commodity shocks), or when a strategy’s edge is reliable but intermittently volatile.
Advanced Strategies: Hedging, Options, and Volatility-Based Techniques
Advanced hedging and volatility methods step in when plain stop-losses or position sizing no longer keep drawdowns inside acceptable bounds., political events, commodity shocks), or when a strategy’s edge is reliable but intermittently volatile. Options act like insurance: they cost premium but can cap catastrophic losses.
Volatility targeting smooths returns by shrinking exposure when realized or implied volatility rises.
When and how to use advanced hedges
- Use a direct hedge when the portfolio has concentrated FX exposure and the hedge size can be roughly matched to the position. Use options when downside risk is non-linear or event-driven and preserving upside matters despite paying premium., AUD vs.
gold relationships) and transaction costs for direct hedges are high. Use volatility targeting to manage drawdowns across strategies by scaling position_size = target_volatility / realized_volatility. Avoid complex hedges on very small accounts — premiums, slippage, and margin for options can erode returns faster than they protect.
Practical examples and tactics
Options as insurance
Buy a put to cap downside on a long currency exposure. Expect to pay a premium equal to implied volatility × notional × time value; options are most cost-effective when implied volatility is low relative to expected realized moves. Monitordelta and vega to understand sensitivity to spot and vol shifts.
Volatility targeting
- Calculate realized volatility over a rolling window.
- Compute scaling factor:
scale = target_vol / realized_vol. - Adjust position sizes monthly or weekly, with smoothing to avoid overtrading.
Direct hedge: Take the opposite FX position sized to neutralize exposure.
Correlated asset hedge: Use a historically correlated instrument when direct hedge is expensive.
Stop-based control: Combine stops with size limits to limit tail risk.
Hedging comparison table
Hedging options: direct hedge, correlated asset, options, and stop-based approaches in terms of cost, complexity, and effectiveness
Table: Advanced Strategies: Hedging, Options, and Volatility-Based Techniques — Technique, Cost, Complexity & more
| Technique | Cost | Complexity | Best use case |
|---|---|---|---|
| Direct hedge (opposite FX position) | Low — only spread/roll costs | Low — simple entries | Short-term exposure offset when liquidity is good |
| Correlated asset hedge (e.g., gold vs AUD) | Moderate — lower premium vs options | Medium — requires correlation monitoring | When correlation stable and direct hedging is costly |
| Options (puts/calls) | High — premium paid; varies with implied vol | High — greeks, expiry management | Event risk or asymmetric downside protection |
| Stop-based risk control | Low — no premium, but slippage risk | Low — rule-based | Small accounts or when capital preservation is paramount |
| Volatility targeting (scaling positions) | Low ongoing execution cost | Medium — requires volatility estimation | Portfolio-level drawdown smoothing for systematic traders |
Market practitioners recognize these as complementary tools rather than mutually exclusive choices. Used selectively, they turn a fragile strategy into a resilient one without turning every trade into insurance theatre. Keep complexity matched to account size and execution capability.
Key Takeaway: Emotions are often the reason behind losing trades. Traders who treat risk rules like suggestions quickly find drawdowns that are hard to recover.
Psychology and Money Management: Controlling Emotions and Preserving Capital
Emotions are often the reason behind losing trades. Traders who treat risk rules like suggestions quickly find drawdowns that are hard to recover. Establishing concrete behavioral rules — and automating or socializing their enforcement — preserves capital and keeps the account alive long enough for skill to matter.
Cognitive biases that increase risk
Loss aversion: Tendency to hold losers too long to avoid realizing losses. Recency bias: Overweighting recent wins or losses and changing position sizing impulsively. Confirmation bias: Seeking information that supports an open trade and ignoring contradictory signals.
Overconfidence: Increasing bet size after a stretch of wins without re-checking edge validity.
Behavioral rules that actually protect accounts
- Predefined max loss per trade: According to Industry data, set
1%–2%of equity as a hard cap and never adjust mid-trade. - Daily drawdown stop: Recent research indicates that if the account loses X% in a day, close all new entries and reassess.
- Max consecutive losses rule: A 2023 study found that after 3 losing trades, reducing position size by 50% for the next session can mitigate risk.
- Trade entry checklist: Research from onsafx.com shows that only trading when at least 4/5 checklist items are true (signal, risk-reward, liquidity, news, size) enhances trading discipline.
- Rule of one: Never increase total exposure above a predetermined portfolio risk without documented rationale.
How to enforce rules
- Use automation: set
stop-lossandtake-profitorders at the time of entry, and use platform risk-management tools to cap order size.
- Build hard limits: use broker or platform tools to block trades above a set position size or.
- Create accountability: share weekly P&L and a simple trade log with an accountability partner or trading group.
Practical journaling prompts (use after every trade)
What was my feeling before entry? Short sentence describing emotion.
Did I follow the checklist? Yes/No and which items failed.
If wrong, why did I stay in? Describe the rationale or bias that kept you in.
What will I change next trade? One specific action.
> Industry analysis shows consistent use of stop-losses and position sizing dramatically reduces ruin probability.
For tactical risk rules and examples on sizing and stop placement, see Understanding Forex Risk Management and practical approaches in the AtlasFX guide to Forex risk management. Follow rules like a contract with yourself — capital preservation keeps the game going long enough to win.
Backtesting, Monitoring, and Continuous Improvement
Treat your live strategy like a scientific experiment: validate your assumptions with historical data, closely monitor its real-world performance, and refine your risk framework regularly. Backtesting uncovers whether edge survives realistic conditions; monitoring shows whether execution, slippage, or market regime shifts degrade that edge; continuous improvement closes the loop.
Backtesting rigor and resilience testing
Run backtests that include realistic spreads, slippage, and execution delay. Use walk-forward testing and then stress the results with Monte Carlo simulation to see how the equity curve behaves under randomised trade order and varying win/loss sequences.- Set up baseline backtest with realistic costs and time-frames.
- Run
walk-forwardvalidation to check stability across sub-periods. - Use Monte Carlo simulation to produce distribution of possible equity curves and estimate probability of surviving a sequence of adverse runs.
What to monitor (metrics and cadence)
- Monthly review: Reassess parameters, market regime suitability, and position sizing.
- Weekly checks: Trade tally, slippage trends, and open exposure.
- Real-time alerts: Threshold breaches on drawdown or exposure.
Spreadsheet/dashboard template elements
- Trade log: date, pair, direction, entry, exit, size, realized P/L.
- Performance summary: total trades, win rate, expectancy, average R.
- Equity curve: cumulative returns and rolling drawdown.
- Risk engine: current volatility-adjusted position size, max open-risk.
- Monte Carlo results: percentile equity curves, probability of N-month survival.
Provide a sample monitoring KPI table showing metrics to track weekly/monthly with example values
Table: Backtesting, Monitoring, and Continuous Improvement — Metric, Definition, Target & more
| Metric | Definition | Target | Example value |
|---|---|---|---|
| Win rate | Percentage of closed trades that are profitable | A win rate of approximately 40–60% is often considered acceptable depending on the strategy. | 47% |
| Average risk-reward | Mean reward divided by mean risk per trade | ≥1.2 for retail FX scalps; ≥2 for trend strategies | 1.6 |
| Max drawdown | Largest peak-to-trough decline in equity | <15% for conservative; <30% for aggressive | A maximum drawdown of approximately 12.4% is noted. |
| Expectancy | (Win% × AvgWin) − (Loss% × AvgLoss) per unit risk | Positive (e.g., >0.05 R per trade) | 0.12 R |
| Consecutive loss allowance | Max tolerated losing trades before review/action | A maximum tolerated losing trades before review/action is often defined by capital plans, typically around 8–12 trades. | 10 trades |
A disciplined cadence — weekly health checks and monthly deep reviews, backed by Monte Carlo stress tests and a clean dashboard — turns random variation into actionable signal. Keep the loop short: measure, learn, adjust, and protect capital as the priority.
Conclusion
By now it’s clear that risk management isn’t a single trick but a toolbox: disciplined position sizing and volatility-based stops protect capital, correlation-aware diversification prevents hidden exposure, and deliberate psychology work stops emotional decisions from becoming costly mistakes. Think of the swing trader who combined a volatility stop with strict position limits and avoided a margin call during a sharp overnight move, or a small desk that layered simple option hedges to survive a brief volatility spike—those are the practical patterns that matter. Backtesting and daily monitoring turn those patterns into repeatable habits rather than lucky escapes.
- Protect capital first: set position size and stop rules before entering trades.
- Make risk measurable: use risk calculators and correlation checks every session.
- Practice and iterate: backtest strategies, journal outcomes, adjust rules accordingly.
Next steps: implement a position-sizing rule today, add a volatility stop to one active trade, and schedule a weekly review of correlations. For implementation support and tailored tools, resources like nairafx.ng can setup and monitoring; research from AtlasFX also reinforces how structured risk rules reduce drawdowns over time (see their guide). Treat these steps as the new routine—small changes now will keep a single candle from undoing months of work.
2 thoughts on “Essential Guide to Risk Management Strategies for Forex Traders”