
Why does an automated trading strategy look brilliant on paper, then stumble when real money is on the line?
Often, that gap arises from weak algorithmic trading evaluation.
A smooth backtest can cover up poor fills, weak assumptions, and a pattern that worked only in a specific market condition.
A proper trading strategy assessment looks beyond just the profit curves.
It asks whether the logic still holds during choppy sessions, sudden spikes, thin liquidity, and the messy conditions that traders actually face.
That matters even more now, when many systems are built to trade fast and often.
The best automated setups don’t just show flashy results.
They also endure slippage, drawdown, and changing market behavior while maintaining discipline.
The real test is simple.
If a strategy cannot explain its edge, tolerate stress, and stay consistent across different conditions, it is not ready for trust.
Quick Answer:
Trusting an automated trading strategy starts with clear benchmarks: profit stability, drawdown limits, consistency, and execution quality.
Begin your assessment by closely examining max drawdown limits, stop-loss measures, and the adequacy of position sizing to ensure performance metrics hold true even when accounting for transaction costs like spreads and commissions.
Due to the unique volatility of the Nigerian markets, these evaluations are not just theoretical; real-world performance can differ greatly under unpredictable conditions.
Understanding these dynamics fosters a more rigorous exploration into what makes a trading strategy reliable beyond just numerical success.
> Key Takeaway:
> Key Takeaway:
What Should We Really Measure Before Trusting an Automated Strategy?
A profitable backtest can still hide a fragile system.
> Key Takeaway:
What Should We Really Measure Before Trusting an Automated Strategy?
A profitable backtest can still hide a fragile system.
What Should We Really Measure Before Trusting an Automated Strategy?
A profitable backtest can still hide a fragile system.
The key question is whether an automated strategy can make money in real trading.
It’s whether it can handle tough runs, messy fills, and shifting market conditions.
That is why algorithmic trading evaluation starts with four checks: profit, drawdown, consistency, and execution quality.
A trading strategy assessment that skips even one of them can look strong and still fail the first time spreads widen or volatility jumps.
Nigerian traders have another layer to weigh.
Broker quality, forex access rules, funding delays, and weekend gap risk can turn a neat backtest into something very different in live trading.
Core evaluation checklist
Table: What Should We Really Measure Before Trusting an Automated Strategy? — Evaluation area, What to check, Why it matters & more
| Evaluation area | What to check | Why it matters | Pass/Fail signal |
|---|---|---|---|
| Risk control | Max drawdown, stop-loss rules, position sizing | Shows how much damage the strategy can do in bad runs | Pass if losses stay within your comfort zone and the size of losing streaks is manageable |
| Historical performance | Win rate, profit factor, expectancy | Shows whether the strategy has an edge after costs | Pass if results stay positive once spread, commission, and swaps are included |
| Execution quality | Slippage, spread sensitivity, latency | Shows how real-world trading may differ from backtests | Pass if live results stay close to the model under normal broker conditions |
The numbers still need to be weighed against live market conditions, not just ideal historical data.
A simple example makes the risk obvious.
According to recent research indicates that a strategy can show a 62% win rate and still lose money if the average loss is much larger than the average win.
It can also fail quietly if it only works when spreads are unusually tight.
Nigerian market conditions make that assessment more demanding than it first appears.
A system that looks stable on a chart may behave differently when execution slips, liquidity thins, or access conditions change during stressful sessions.
The strongest trading strategy assessment asks one more question: would this still work if every trade filled a little worse than expected? If the answer is shaky, the system is not ready for real money yet.
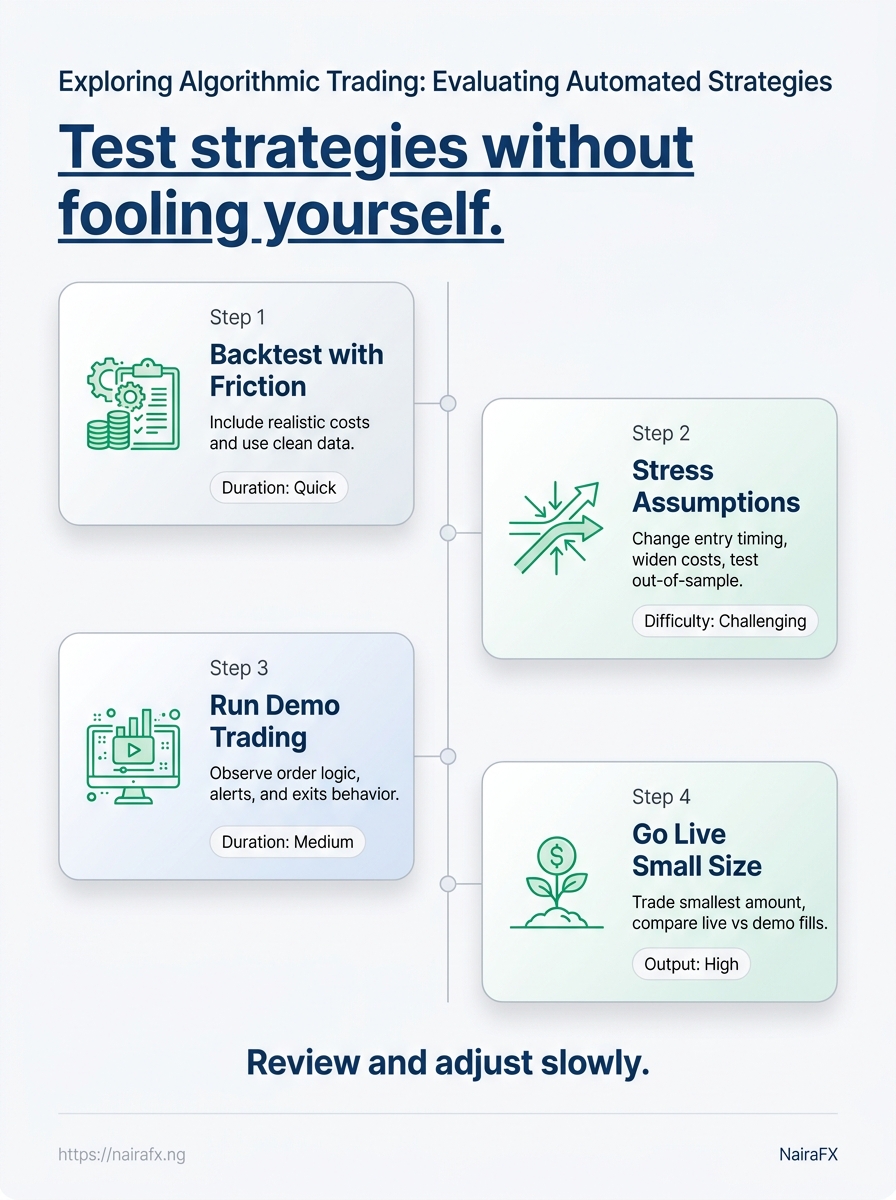
How Do We Test an Automated Trading Strategy Without Fooling Ourselves?
To understand why many automated trading strategies seem perfect in testing but fail in volatile markets, you must shift from ideal situations to real-life scenarios.
This involves acknowledging how real-world factors—like delays in execution and varying fills—impact performance.
To ensure evaluations, strategic assessments should incorporate various forms of testing, from historical backtests with realistic conditions like slippage and commissions to demo simulations that mimic actual market behavior.
This sequence safeguards against over-reliance on results derived from optimized testing that lacks empirical backing.
> Key Takeaway:
> Key Takeaway:
Why Do Some Strategies Look Great on Paper but Fail in Real Trading?
A strategy can look tidy on a spreadsheet and still bleed cash once…
> Key Takeaway:
Why Do Some Strategies Look Great on Paper but Fail in Real Trading?
A strategy can look tidy on a spreadsheet and still bleed cash once the spread widens.
Why Do Some Strategies Look Great on Paper but Fail in Real Trading?
A strategy can look tidy on a spreadsheet and still bleed cash once the spread widens.
Failures often emerge with quick entries, small profit targets, and trading in thin markets.
Consider a simple breakout bot on EUR/USD.
On paper, it wins often because fills are assumed at the signal price, but live trades face spread, delay, and slippage before the first candle even closes.
In algorithmic trading evaluation, the signal is often not the complete picture.
Execution cost is often the part that turns a promising system into a weak one.
Paper vs live performance
Table: Why Do Some Strategies Look Great on Paper but Fail in Real Trading? — Metric, Backtest result, Live result & more
| Metric | Backtest result | Live result | What the gap means |
|---|---|---|---|
| Win rate | High | Lower | The strategy may depend on ideal conditions |
| Profit factor | Strong | Weaker | Trading costs may be eating the edge |
| Drawdown | Controlled | Deeper | The system may be less stable in live markets |
| Trade frequency | Consistent | Uneven | Market conditions may affect signal quality |
The entries still trigger, but the fills drift, exits miss by a few points, and the clean curve starts to sag.
That is why trading strategy assessment should compare the same metric in three places: backtest, demo, and live.
When one of them breaks sharply, the strategy is probably too sensitive to real-market friction.
A simple do-vs-don’t check catches many of the common traps.
- Do use broker-specific spreads: Price the system with the costs your account actually pays.
- Don’t trust mid-price fills: They make automated trading strategies look cleaner than they really are.
- Do log requested and filled prices: That exposes slippage instead of hiding it inside performance.
- Don’t judge by win rate alone: A high win rate can still fail if losses grow faster than winners.
- Do compare trade frequency across environments: A live drop often signals weak liquidity or fragile entries.
This is where many systems crack.
They were built for ideal fills, not for the messy reality of live execution.
Once that gap is visible, the fix gets much clearer.
The strategy may need wider targets, slower entries, or a cost model that matches the market it trades.
> Key Takeaway:
Which Risk Checks Matter Most for Traders in Volatile Markets?
Which risk check saves a trading account fastest when prices start whipping around?
Which Risk Checks Matter Most for Traders in Volatile Markets?
Which risk check saves a trading account fastest when prices start whipping around? It is rarely the entry signal.
In volatile markets, drawdown limits, position sizing, and emergency stop rules handle most of the pressure.
A solid trading strategy assessment starts with those three controls.
If these controls are weak, even good automated trading strategies can quickly become problematic, especially when spreads widen or prices gap.
A useful mini-case makes this plain.
Imagine a trader running a forex system during a sharp risk-off move, with price jumping from one candle to the next.
A hard daily loss cap can shut the system down after a bad stretch, while a fixed small position size keeps the damage contained.
Without those rules, one ugly session can do more harm than a week of normal losses.
Healthy vs unhealthy risk settings in practice
Table: Which Risk Checks Matter Most for Traders in Volatile Markets? — Risk control, Safer setup, Risky setup & more
| Risk control | Safer setup | Risky setup | Assessment tip |
|---|---|---|---|
| Position sizing | Fixed small percentage per trade | Large or inconsistent sizing | Check whether losses stay manageable |
| Stop-loss use | Always enabled | Missing or rarely used | Missing stops often signal poor discipline in code |
| Max daily loss | Predefined limit | No limit | Look for a hard guardrail |
| Market filter | Trades only in suitable conditions | Trades in every condition | A filter can reduce unnecessary losses |
Unhealthy ones often look fine in calm periods, then break the moment market noise rises.
For algorithmic trading evaluation, the best question is not “Does it make money?” It is “Does the risk stay controlled when the market stops behaving?” A system that loses a little and resets is usually more valuable than one that chases every move and blows up under pressure.
That is why the strongest automated trading strategies usually feel boring on their worst day.
They cut risk early, limit size, and stop trading when conditions turn ugly.
In volatile markets, boring is often the difference between staying in the game and starting over.
How Can We Judge Whether a Strategy Fits a Real Trader, Not Just a Spreadsheet?
A trader in Lagos may have 45 minutes before work, patchy internet during the day, and a market that can turn sharply after a news release.
That is a very different reality from a clean backtest running on a perfect desktop setup.
A true trading strategy assessment must answer one straightforward question: can this system work in the trader’s real life, not just in an ideal situation? That means checking time demand, monitoring load, capital pressure, and broker access before any live money goes in.
The fastest way to judge fit is to score the strategy against four practical tests.
If it needs constant supervision, large margin room, or a broker setup the trader cannot reliably access, the system is already asking for too much.
- Time commitment: Count the minutes needed to check signals, place trades, and review open positions each day.
- Monitoring needs: Decide whether the strategy can handle missed alerts, delayed internet, or a phone-only workflow.
- Capital requirements: Check whether the account can absorb the position size, fees, and drawdown without strain.
- Broker access: Confirm the broker supports the instruments, order types, and execution speed the system expects.
A simple decision template keeps the process honest.
Score each area from 0 to 2: 2 for a comfortable fit, 1 for a workable fit, and 0 for a poor fit.
- Keep: Total score of 7-8. The strategy matches the trader’s schedule, tools, and account size.
- Pause: Total score of 4-6. The idea may work, but live use needs changes, such as smaller size or fewer trades.
- Reject: Total score of 0-3. The system depends on conditions the trader cannot reliably provide.
One useful test is to imagine a bad week, not a perfect one.
If the trader misses an alert, loses internet for an hour, or sees volatility jump after a policy headline, the strategy should still behave in a controlled way.
That is the real measure of algorithmic trading evaluation.
A system that only works when everything goes right is not ready for live trading.
What is walk forward backtesting?
Walk forward backtesting is a validation method that repeatedly re-optimizes a trading strategy on a past “training” window and then tests it on the next “forward” window.
You move window-by-window, so performance is measured on unseen data rather than a single in-sample backtest.
This directly reduces the risk of a fragile setup that only works in one market regime.
Can ChatGPT backtest trading strategy?
ChatGPT can help you design a backtest, write strategy logic, and outline evaluation steps, but it cannot reliably run a true backtest by itself because it has no built-in access to your market data, broker fills, or execution environment.
To validate performance, you must run the strategy in a proper backtesting platform and include friction like spreads, slippage, fees, and execution delays.
Use AI outputs as a guide, not as the final proof.
What is the 3 5 7 rule in trading?
The 3-5-7 rule is a commonly used risk-management guideline, typically interpreted as risking 3% per trade, 5% in daily losses, and limiting total weekly drawdown to 7%.
Its purpose is to prevent a strategy from collapsing during volatility spikes and messy execution conditions.
Pair it with strict drawdown limits, position sizing, and emergency stop rules—controls that determine whether an automated system survives real markets.
How to do walk forward analysis?
Walk forward analysis is done by splitting your history into rolling segments: fit or parameters on one period, then test on the next period without re-optimizing.
Repeat this process across multiple market regimes and record out-of-sample results.
Include realistic trading frictions (spreads, commissions, swaps, slippage, and execution delays) so the edge remains positive under changing conditions—not just on clean historical fills.
What is a good Sharpe ratio for algo trading?
A Sharpe ratio above 1.0 is often treated as a decent threshold for algo strategies, while above 2.0 is generally strong and above 3.0 is exceptional for most systematic approaches.
However, Sharpe alone is not enough—an automated strategy must also pass drawdown limits, consistency checks, and execution-quality verification under wider spreads and higher volatility.
The best target is one that holds up across stress conditions, not one that only looks good on paper.
Trust the Stress Test, Not the Curve
A strategy that looks great on paper hasn’t proven itself in the real world.
You now have four key tools to evaluate automated trading systems: (1) a checklist for metrics like profit, drawdown, consistency, and execution quality, (2) a workflow that moves from backtest to demo to small live trading with realistic friction, (3) a comparison of paper vs live results using the same metrics, and (4) risk rules to keep losses in check during volatile periods.
Your next step (do this once, then reuse the checklist)
Choose one strategy and run it through the same evaluation path using your broker’s actual costs and execution conditions:- Compare backtest vs demo using the same metrics.
- Verify drawdown and risk limits match your pre-set account constraints.
- If spreads/slippage/latency effects don’t break the edge, move to small live sizing.
- If the results fail the stress test, iterate on the assumptions or stop using the strategy.
When the system stays controlled under real conditions, you’re no longer guessing—you’re following an evaluation process you can defend.