

> Key Takeaway:
Why does a trading record that looks strong on paper still fall apart the moment real money is on the line?
This gap often begins with a narrow interpretation of historical performance.
Why does a trading record that looks strong on paper still fall apart the moment real money is on the line?
This gap often begins with a narrow interpretation of historical performance.
Profit matters.
But so do drawdowns, losing streaks, trade size, and how results were achieved in different market conditions.
Good trading strategy analysis goes beyond the equity curve.
A smooth rise can hide weak risks.
On the other hand, a rough period can still indicate a strong system if losses are controlled and logic remains sound.
The real test in evaluation of trading history is pattern, not polish.
A strategy that only worked in one calm market, or only during one direction, is telling a much smaller story than most traders expect.
That is why the sharpest reading of historical performance trading looks for consistency, pressure points, and recovery behavior.
A record should show how a strategy behaves when spreads widen, volatility jumps, or winners arrive in clusters instead of evenly.
Historical performance helps you check if a rules-based edge holds up in real trading conditions, not just show that a system looks good.
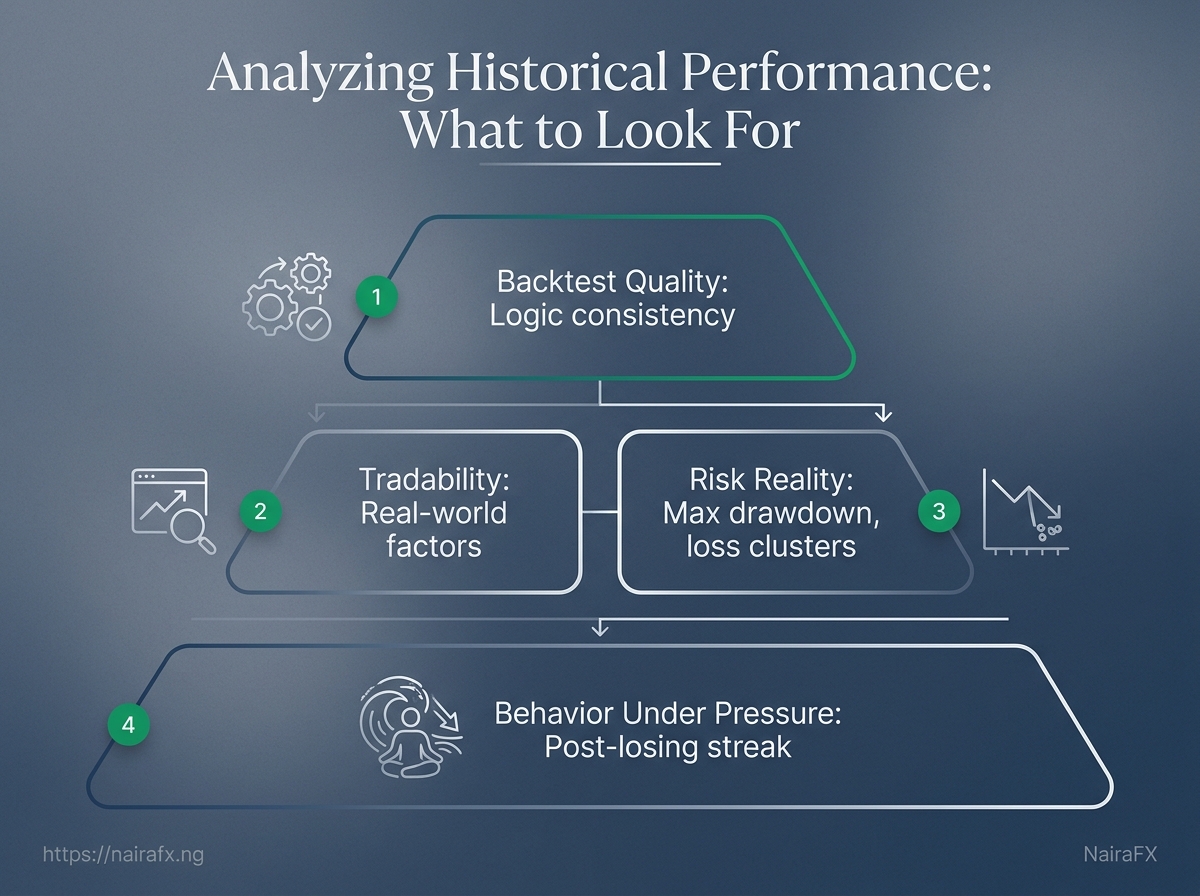
Focus on expectancy, maximum drawdown, and how risks behave in worst-case scenarios.
This requires examining drawdown depth, duration, and how trades group under different market conditions.
A good backtest factors in tradability elements, such as slippage and position sizing, to ensure that the results are more than just superficial success on paper.
Understanding Historical Performance
Historical performance trading means checking if a trading strategy consistently works under different market conditions while factoring in costs and noise.
Traders often mistake strong-looking backtests for proof of a reliable system.
This misunderstanding can lead to poor real-money trading decisions.
Rather than just checking if a system is ‘good’, the goal is to show how reliable the strategy is in various market situations.
It’s crucial to differentiate between a good backtest, which demonstrates rule consistency, and a tradable strategy which considers practicalities like slippage and execution conditions.
In evaluating strategies, focus on metrics beyond just the win rate—like expectancy, drawdown, and risk exposure.
Remember, a strong performance record needs to endure adverse market conditions to validate its effectiveness.
> Key Takeaway:
> A high win rate may hide a weak strategy.
Industry data shows that a 70% win rate can still be poor if the losses are bigger than the wins.
> A high win rate may hide a weak strategy.
Industry data shows that a 70% win rate can still be poor if the losses are bigger than the wins.
That…
Bold claim: A high win rate can still hide a weak strategy
Industry data shows that a 70% win rate can still be poor if the losses are bigger than the wins.
That happens often in historical performance trading, especially when traders stop at the first number that looks impressive.
Win rate answers one narrow question: how often did trades close in profit? Trading strategy analysis needs a wider lens.
You get a clearer view from expectancy, average win, average loss, and the reward-to-risk gap between them.
A strategy can look smooth on the surface and still bleed money over time.
A few oversized losses can erase many small wins, which is why the evaluation of trading history must go beyond the hit rate.
Average win, average loss, and reward-to-risk in plain language
Table: Bold claim: A high win rate can still hide a weak strategy — Metric, What it Measures, Why It Matters & more
| Metric | What it Measures | Why It Matters | Common Red Flag |
|---|---|---|---|
| Win rate | Percentage of winning trades | Useful, but incomplete on its own | High win rate with poor overall return |
| Expectancy | Average result per trade over time | Shows whether the system is positive over many trades | Positive win rate but negative expectancy |
| Average win/loss ratio | Size of winners compared with losers | Helps reveal if big losses cancel many small wins | Small average win and large average loss |
| Profit factor | Gross profit divided by gross loss | Quick view of historical efficiency | Looks strong but is based on too few trades |
The same thing happens when traders ignore expectancy, which blends frequency and payoff into one cleaner measure.
Average win and average loss matter because they expose the trade shape, not just the outcome count.
If the average win is ₦8,000 and the average loss is ₦20,000, the account needs a very strong edge just to stay afloat.
- Check the payoff gap: Compare the average win directly against the average loss.
- Look past the hit rate: A high win rate means little if losses are outsized.
- Watch profit factor carefully: Strong numbers can still come from too few trades.
- Review trade distribution: One or two big losers can distort a whole backtest.
The quickest test is simple: ask whether a trader is winning often, or winning well.
That question keeps historical performance trading grounded in reality, not in vanity metrics.
A good evaluation of trading history should reward balance, not just frequency.
When the payoff structure is weak, the win rate is usually hiding the damage.
> Key Takeaway:
> Key Takeaway:
Short story: The strategy that looked great until the market changed
A trader builds a clean breakout system in a quiet market.
For…
> Key Takeaway:
Short story: The strategy that looked great until the market changed
A trader builds a clean breakout system in a quiet market.
For months, it appears effective: small losses,…
Short story: The strategy that looked great until the market changed
A trader builds a clean breakout system in a quiet market.
For months, it appears effective: small losses, consistent wins, and a smooth equity line that suggests the method is proven.
Then volatility jumps.
Spreads widen, candles get larger, and the same setup starts firing in the wrong places.
In historical performance trading, this is where a strategy’s weakness becomes clear, since the market does not act like it did in the backtest.
Consider a trader in a fast-moving Nigerian FX setup who used fixed entries above recent highs, tight stops, and a target that had worked well during calmer weeks.
The first thing to fail was not the entry signal itself.
It was the exit logic, because the stop sat too close to normal market noise.
After that, risk control cracked.
Position size stayed the same while daily swings grew, so one bad stretch erased several good trades.
That pattern is common in evaluation of trading history: the system looks disciplined until changing conditions expose assumptions that were never tested.
What failed first
The entry often survives longer than people expect.
A breakout can still trigger in a volatile market, but the fill quality and follow-through may be completely different.
The exit usually fails next.
A stop that made sense in a narrow range becomes too tight, while a profit target that once seemed realistic gets missed because price overshoots and reverses faster than usual.
Risk control is the last layer to break, and it hurts the most.
Once volatility rises, fixed lot sizes and fixed stop distances can turn a decent setup into a fast drawdown.
- Entry logic: Works on paper, then gets hit by false breaks and faster reversals.
- Exit logic: Becomes fragile when normal price noise expands.
- Risk control: Fails hard if sizing ignores changing volatility.
Why Nigerian traders should care
Nigeria’s market conditions can shift quickly.
Policy moves, liquidity changes, and currency pressure can alter how price behaves from one week to the next.
That is why trading strategy analysis cannot stop at a pretty curve.
The better question is whether the method still makes sense when spreads widen, slippage grows, and price starts moving in uneven bursts.
A simple check helps: compare the strategy across quiet periods, high-volatility periods, and news-heavy sessions.
If performance only holds in one regime, the history is not as strong as it first looked.
That gap matters a lot in historical performance trading.
A strategy is only as good as the market it can survive.
Surprising stat: Small sample sizes can create fake confidence
You might find a strategy convincing after just 20 trades, but it could still be mostly noise.
That is the trap in historical performance trading: the equity curve starts to look familiar before the market has really tested the rules.
Fast-moving markets make this worse.
A month of calm price action, then one sharp shift in spreads, volatility, or news flow, can turn a “proven” setup into a fragile one.
For evaluation of trading history, the number of trades matters more than the shine of the last few winners.
As a practical guide, conclusions drawn from fewer than 30 trades should stay tentative, 50 trades starts to give a clearer picture, and 100 or more is much more useful when the strategy is active enough to generate that many samples.
That said, trade count alone is not enough.
A strategy with 80 trades from one quiet market regime can still mislead you, while 40 trades spread across different conditions may tell you much more.
Recency matters because markets do not sit still; the conditions that created an edge last quarter may not exist now.
A good trading strategy analysis should ask whether the sample includes different volatility phases, news cycles, and session changes.
If all the trades came from one narrow stretch, the confidence is fake.
A simple sample-size check helps keep things honest:
- Trade count: Fewer than 30 trades means weak evidence; treat results as a draft, not a verdict.
- Time spread: Make sure trades are spread across months, not squeezed into one lucky stretch.
- Market variety: Check whether the history includes quiet, choppy, and trending periods.
- Recent performance: Give extra weight to the latest results if the market structure has changed.
- Loss clusters: Look for repeated damage in the same conditions, not just the average outcome.
- Execution realism: Confirm that spreads, slippage, and fills were realistic for the period tested.
In practice, the safest evaluation of trading history asks one question: would this edge still look credible if the next 20 trades were less friendly? If the answer feels shaky, the sample is still too small.
That discipline saves traders from mistaking a lucky run for a durable edge, and it keeps the numbers useful when the market changes shape.
Contrarian take: The best-looking equity curve is not always the safest
A smooth equity curve can look like discipline, but it can also hide fragile risk.
In historical performance trading, that matters because a tidy line often tells you less than the path behind it.
A strategy can rise steadily while carrying heavy hidden exposure.
It may be averaging into losers, running too much position size, or depending on a market mood that has not been challenged yet.
That is why trading strategy analysis should never stop at the ending balance.
The real test is how the account behaved while the strategy was working.
Drawdown is only one part of the picture.
Recovery time matters just as much, because a shallow dip that takes months to climb back can tie up capital and drain confidence.
The stress on the account is the part traders often feel first.
A curve that looks calm on paper can still force ugly decisions in live trading, especially when margin gets tight or losses cluster in one stretch.
A better evaluation of trading history looks for shape, not shine.
A choppy curve that recovers fast can be healthier than a polished curve that quietly depends on one bad loss never arriving.
Read the curve like a risk report
- Check the depth of drawdowns: A system with mild ups and downs can still fail if one loss wipes out months of progress.
- Measure recovery speed: Fast recovery usually shows resilience; slow recovery often means the strategy is capital-heavy or emotionally hard to hold.
- Watch for hidden pressure: If a strategy needs large size to look smooth, the account may be carrying more risk than the chart admits.
- Compare return to pain: Two strategies can finish at the same profit, yet one demands far less emotional and financial strain.
- Question unreal beauty: When a curve looks almost too clean, ask what was absorbed off-screen.
A useful habit is to ask one simple question during evaluation of trading history: “What would this curve look like after one ugly week?” That question exposes more risk than a month of pretty gains ever will.
The safest-looking curve is not always the safest system.
In practice, the healthiest equity line is the one that can take a hit and keep breathing.
Scenario: You are choosing between two systems before risking real capital
You might find two systems that look nearly identical on paper, but they can behave quite differently in live trading.
That is the point where historical performance trading stops being abstract and starts feeling expensive.
Imagine both systems show a similar profit factor, similar win rate, and similar net return.
One trades steadily across many market moods, while the other depends on a narrow stretch of calm conditions.
In trading strategy analysis, that difference matters more than the headline numbers.
When the numbers are similar, the real challenge is evaluating trading history.
Look past the final equity curve and compare how each system actually earns its returns.
A strategy that wins often in tiny bursts may still be more fragile than one that trades less often but holds up across different market states.
The first filter is trade frequency.
A system that fires 300 times a year gives you far more evidence than one that trades 18 times.
That does not make the busy system better by default, but it usually makes its sample more useful.
The next filter is market condition fit.
One system may only work in strong trends, while the other survives ranges and breakouts.
If you cannot explain when a strategy tends to perform best, it is not ready for live capital.
- Trade frequency: Compare how many trades each system needs to show its results. Low frequency can hide weak evidence.
- Market regime: Check whether profits come from trends, ranges, high volatility, or quiet periods. A narrow setup is easier to break.
- Execution quality: Review entry delay, spread impact, and slippage sensitivity. A paper edge can vanish fast in live conditions.
- Loss shape: Study how each system loses money. Small frequent losses can be easier to manage than rare deep drawdowns.
- Capital efficiency: Ask how long money stays tied up. A system that holds positions too long can block better opportunities.
Reject a strategy when the story behind the numbers feels too neat.
If most of the gains come from one market phase, one instrument, or one cluster of trades, the edge may be thin.
A simple real-world test helps: if a system still looks strong after you remove its best month, widen spreads a little, and cut trade size variance, it deserves a closer look.
If it falls apart quickly, the attractive numbers were doing too much work.
That is the discipline here.
Similar results are not the same as similar quality.
Question: What should we verify before calling a strategy trustworthy?
A strategy is trustworthy when the historical record supports two separate claims:
1) The rules have edge (the model logic holds up across markets and conditions, after realistic costs). 2) The process is executable (a real trader can follow the plan without breaking the risk and timing assumptions).
Keeping those claims separate matters in historical performance trading.
Backtests can’t confirm execution discipline, and journals can’t prove the setup has true expectancy by themselves.
What to verify first
Before anyone treats results as “durable,” check these items.
If one fails, treat the strategy as unproven and keep diagnosing.
- Rule clarity: Every entry, exit, stop, and sizing step should be written so it can be followed the same way twice.
- Cost realism: Spreads, commissions, swaps, and slippage should match the instrument and the testing period.
- Market fit: The setup should logically match the pair, session, and volatility regime it traded.
- Evidence stability: Results shouldn’t rely on one unusual month, a single outlier run, or a narrow slice of conditions.
- Execution gap: Planned trades and what happened in practice (or in your simulation assumptions) should be close enough to trust the process.
Journal review versus backtest review
Use two different lenses:
- Backtest review (system): Do the rules behave consistently across historical samples, and are the assumptions fair?
- Journal review (trader): Do real executions match the plan—entries weren’t skipped, exits weren’t rushed, and risk rules held when pressure rose?
How to connect history to future trades
Future decisions should be driven by the reason evidence changes, not by the fact it changes.
- If the journal shows repeated late entries, the fix is often timing discipline, not a new strategy.
- If the backtest weakens only in a specific volatility band, you may need a filter or smaller size—not automatic abandonment.
A practical decision workflow:
- Separate failure type: setup error vs execution error.
- Change one variable at a time: update a filter, risk rule, or sizing method separately.
- Re-test the adjustment on fresh data (or run a demo period) before scaling.
Trust comes from evidence that survives both the rule test and the execution test.
What is the 3 5 7 rule in trading?
The 3-5-7 rule is a timeframe-based guideline that uses three, five, and seven periods to confirm a trade and reduce noise.
Traders typically look for alignment across those short, intermediate, and slightly longer signals before entering, so the entry isn’t driven by a single flicker in price.
It’s essentially a filter for consistency rather than a guaranteed edge.
What is the best trading strategy in 2026?
There is no single “best” trading strategy for 2026 that works regardless of market conditions.
The best strategy is the one whose rules keep delivering positive expectancy after costs and through adverse conditions, including spread and volatility changes.
Focus evaluation on drawdown depth, drawdown duration, loss clustering, and whether results hold up when trade sizing and slippage are realistic.
Is the pattern day trading rule now $2000 and not $25,000?
S. investors who meet the pattern day trader definition.
The $2,000 figure is commonly related to minimum margin account requirements or limited day-trading buying power, not the full “PDT equity” threshold for avoiding restrictions.
Always confirm the exact requirement with your broker and account type.
Is a 70% win rate good in trading?
A 70% win rate can be good, but it is not automatically good trading.
A strategy can still lose money if the losses are larger than the wins, which is why historical performance analysis must include expectancy, average win versus average loss, and reward-to-risk—not just how often trades close profitable.
Also check drawdowns and recovery time to see whether the risk is controlled.
What a Trading Record Really Proves
A strong trading history doesn’t guarantee that the strategy is safe.
It proves that, under specific conditions, a set of rules produced those results, which is a very different thing.
That is why historical performance trading works best when you treat it as evidence, not a promise.
The strategy that looked brilliant before the market changed was the clearest warning in the article.
A high win rate, a smooth equity curve, or even a streak of profits can hide weak risk control, thin data, or a bad fit for current conditions.
Real trading strategy analysis poses a tougher question: would this still work if volatility changes, spreads increase, or the market acts differently?
Review the trade history before you trust the result.
Look at sample size, drawdown, average loss, and whether the gains came from one lucky stretch or from repeated edge.
If you want a deeper pass, our team at NairaFX builds that kind of evaluation of trading history with risk and market context in mind.
The best move today is simple: pull one live or backtested strategy, test it across different market phases, and see whether it still deserves real capital.