

Nothing hurts trading confidence like watching a sharp move wipe out a position while news headlines and chart clutter offer no clear reason. Traders recognise the same pattern: sudden volatility, erratic liquidity, and the uncomfortable feeling that price moves don’t match the story on the screen.
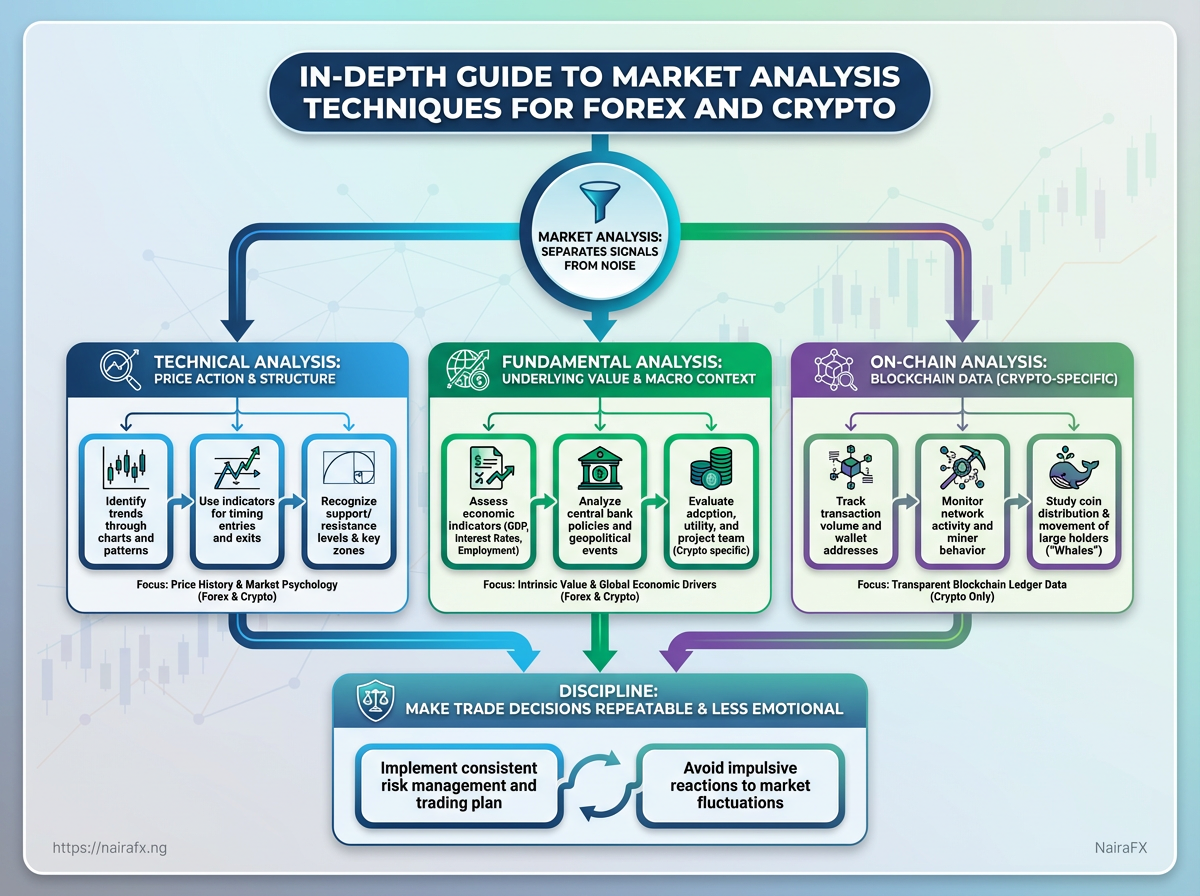
Real edge comes from disciplined market analysis that separates readable signals from random noise, mixing technical analysis, fundamental analysis, and on-chain analysis where relevant. Those labels sound neat, but the real work is a set of practical checks that make trade decisions repeatable and less emotional.
Seasoned traders use mental models that expose why price moved: structure shifts, liquidity pools, order flow imbalances, and macro context that alters risk appetite. Learn to spot those cues quickly, and the market’s chaos becomes a map rather than a riddle.
Executive Summary
This analysis synthesizes four complementary pillars of trading evaluation into a tight, actionable workflow so strategic traders can make faster, higher-confidence decisions in volatile Nigerian markets. The focus is pragmatic: combine price action, macro context, risk-profile mathematics, and execution quality into a single routine that surfaces the best trade ideas and limits surprise losses.
Core pillars explained
Price Action: Short- to medium-term market structure, liquidity zones, and momentum signals that determine entry and exit windows.
Macro Context: Interest-rate moves, commodity flows (especially oil and FX liquidity), and regional risk sentiment that shift risk appetite across asset classes.
Risk Mathematics: Probabilistic evaluation of trades using position sizing, expected drawdown, and Monte Carlo scenario testing to estimate real-world outcomes.
Execution Quality: Slippage, spread, and execution latency — practical factors that turn theoretical edge into realized profit (or loss).
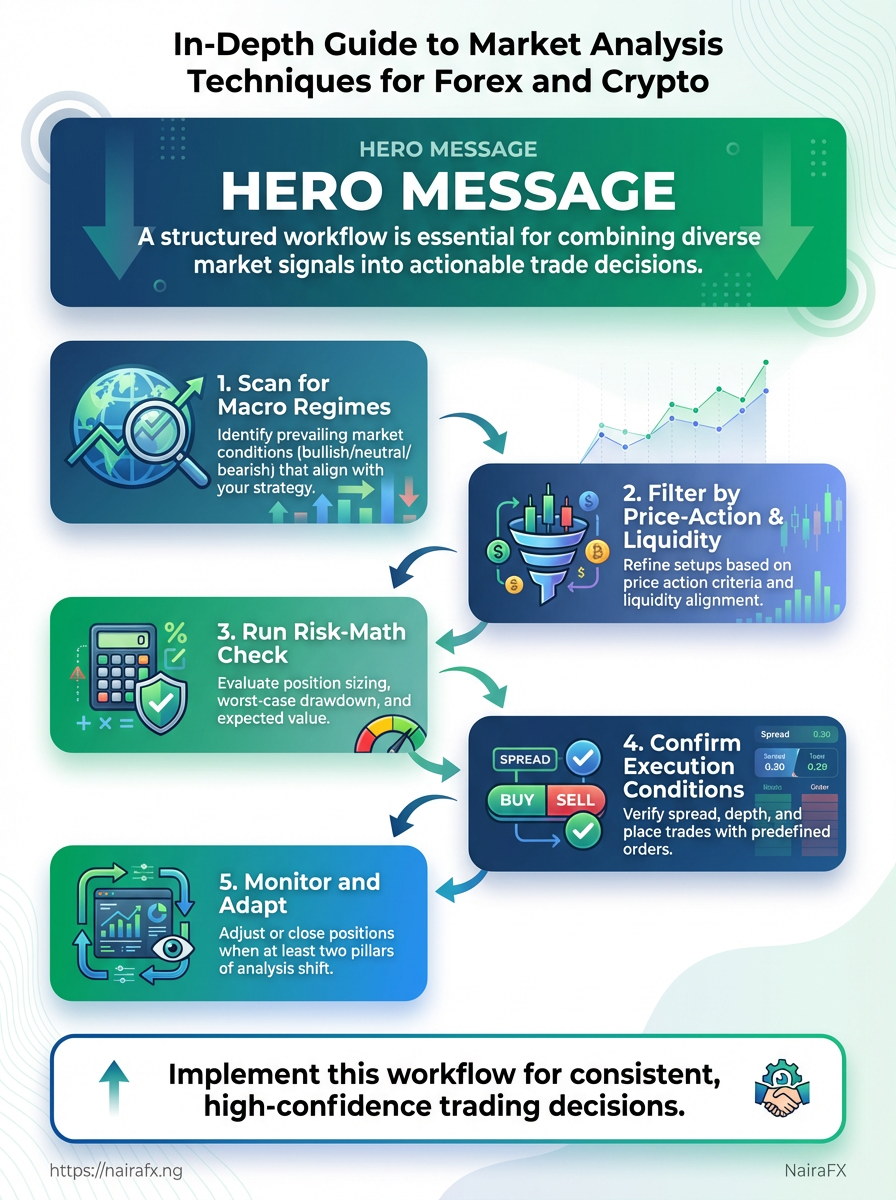
Recommended workflow for combining signals
- Scan for macro regimes that allow your strategy (bullish/neutral/bearish).
- Filter setups by price-action criteria and liquidity alignment.
- Run a quick risk-math check: position size, worst-case drawdown, and
expected value.
- Confirm execution conditions (spread, depth) and place the trade with predefined orders.
- Monitor and adapt using the same pillars; close or scale only when at least two pillars shift.
Top 3 immediate actions for strategic traders
- Recalibrate position sizing: Use scenario-based sizing (small to medium sizes until
Monte Carloconfirms strategy robustness). - Add an execution checklist: Track average slippage and cancel trades when slippage > planned threshold.
- Hybrid signal rule: Require one momentum signal plus one macro confirmation before adding new positions.
Practical example: if oil-driven FX weakness signals a bearish macro, accept short setups only where price action shows failed support and risk math keeps drawdown below 2% of equity.
This approach turns fragmented signals into a repeatable routine that reduces emotional decisions and highlights where to focus improvement — whether it’s refining your risk model, improving execution, or reading macro flows.
1. Technical Analysis Techniques
Start with price action and market structure; everything else should be context and execution around that. Price swings, support/resistance and the sequence of higher highs/lower lows give the map — use multiple timeframes to see both the road and the nearby intersections. Define explicit entry, stop and target rules for every setup before risking capital, then validate those rules through systematic backtesting.
Core technical principles (short)
- Price action first: Read candles, structure, and liquidity. Indicators confirm, they don’t lead.
- Multiple timeframe context: Use a higher timeframe for trend, a medium for structure, and a lower for entries.
- Rule-based entries: Every setup requires a defined trigger,
stoplevel, andtargetobjective.
Core Technical Tools and Setups
Side-by-side comparison of common technical setups showing timeframe, entry signal, stop placement, target and ideal market condition
| Setup | Best Timeframes | Entry Signal | Stop Placement | Profit Target | Ideal Market Condition |
|---|---|---|---|---|---|
| Breakout from consolidation | 4H / Daily | Close above consolidation high on volume | Below consolidation low or recent swing low | 1.5–3× stop | Trending or beginning of trend expansion |
| Moving average crossover | 1H / 4H | Fast MA crosses above slow MA with trend confirmation | Below recent swing low or below slow MA | 2× stop or next resistance | Clear trending markets |
| Pullback to trendline | 15m / 1H / 4H | Price rejects trendline with bullish/bearish candle | Below/above trendline touch + buffer | Risk-to-reward 2:1 | Strong trend with orderly pullbacks |
| RSI divergence | 1H / 4H | Price makes new high/low; RSI fails to confirm | Beyond recent swing extreme | Conservatively 1.5–2× stop | Loss of momentum during trends or reversals |
| Order flow momentum | 5m / 15m | Large imbalance / print of aggressive buying/selling | Against the imbalance or high-volume node | Intraday structure targets | High-liquidity instruments (major forex, large-cap crypto) |
Backtesting and Validation Checklist
- Run at least 100 trades per setup across multiple instruments and timeframes.
- Test across bull, bear and sideways market conditions.
- Include realistic fees and slippage in each simulation.
- Track metrics: Win rate, Average reward:risk, Expectancy per trade, Max drawdown, Profit factor.
- Compare walk-forward results: in-sample vs out-of-sample performance.
- Document each trade with timestamp, chart snapshot, and reason for entry/exit.
- Revisit position sizing: simulate fixed fractional and Kelly-derived sizing.
Practical example: backtesting a pullback-to-trendline strategy on EUR/USD over 2 years with 150 trades, 58% win rate and 1.9 reward:risk produced a positive expectancy after 0.5% round-trip slippage was applied.
Keeping setups simple, tested and well-documented prevents emotional deviation when markets get noisy. Stick to clearly defined rules and let validated edge drive position sizing and execution.
2. Fundamental Analysis for Forex and Crypto
Fundamental analysis for FX and crypto starts with different inputs but the same purpose: estimate future price direction by understanding underlying drivers. For forex, macro and monetary indicators move currencies through shifts in expected interest-rate differentials and growth prospects. For crypto, on-chain metrics reveal supply-side behaviour and investor activity that price charts alone miss. Combining both gives conviction — for example, a hawkish rate surprise plus rising stablecoin inflows to exchanges paints a stronger case for short-term selling pressure on risk assets than either signal alone.
Of key macro releases, typical impact on currency pairs, and recommended trading responses
| Indicator | Typical Impact | Frequency | Recommended Response |
|---|---|---|---|
| Interest Rate Decision | Strong directional move for currency; hawkish → currency strengthens | Varies by central bank (monthly–quarterly) | Reduce directional exposure into event; trade the surprise with tight stops |
| CPI / Inflation | Drives rate expectations; higher-than-expected → local currency strengthens | Monthly | Use inflation surprise to adjust carry and yield trades; consider options for asymmetric risk |
| Nonfarm Payrolls / Employment | Large day-of volatility for USD and G10 crosses | Monthly (first Friday) | Avoid scaling into positions pre-release; use post-release momentum for intraday trades |
| GDP Releases | Medium-term directional bias; strong growth supports currency appreciation | Quarterly | Position size around trend trades; confirm with PMI and employment data |
| PMI (Manufacturing/Services) | Early-cycle indicator for growth and risk sentiment | Monthly | Use PMI surprise to confirm short-term directional bias; better for FX crosses vs. dollar |
Practical simple scoring method for economic releases:
- Assign
+1for better-than-expected,0for inline,-1for worse-than-expected.
- Multiply by surprise magnitude:
score = result min(|surprise| / std_dev, 2)wherestd_devis a short-term historical volatility proxy.
- Sum scores across related releases (e.g., CPI + Unemployment + PMI) to get a composite sentiment score.
- Translate composite score into action:
>1.5= bias to buy local currency;<-1.5= bias to sell; otherwise hold or trade range.
On-chain and crypto fundamental metrics
Active Addresses: Number of unique addresses participating; rising counts suggest increasing usage or demand.
Transaction Volume: Aggregate value transferred; spikes can indicate large movements or adoption events.
Exchange Inflows: Total crypto moving to exchanges; rising inflows often precede selling pressure.
Exchange Outflows: Total crypto moving off* exchanges; sustained outflows imply accumulation and potential bullishness.
Realized Cap / MVRV: Measures capitalization using price at last move; high MVRV can signal overvaluation.
Hashrate / Staking Rates: Network security and participant incentive indicators; declining hashrate can reduce confidence.
Combine on-chain with macro for conviction:
- High exchange inflows + hawkish central bank → elevated probability of crypto selloff.
- Sustained outflows + dovish macro backdrop → stronger case for accumulation.
Practical tip: monitor exchange flows as a near-real-time barometer and weight macro surprises twice as heavily when scoring trades during major economic windows. This makes trade signals more robust without overfitting to noise.
3. Sentiment and Behavioral Analysis
Sentiment isn't a guess; it's measurable market pressure that often precedes price moves. Traders who read the mood correctly can either ride momentum or fade extremes with much higher odds. This section explains the practical signals to watch, how to interpret them across assets, and concrete behavioral rules to keep position sizing and risk under control when markets get emotional.
Sentiment indicators across assets: what they measure, calculation frequency and how to act on extremes
| Indicator | Assets Covered | What it Measures | Signal Frequency | Trader Action |
|---|---|---|---|---|
| Funding Rates | Crypto perpetuals (BTC, ETH, altcoins) | Net long vs short funding pressure between spot and derivatives | Hourly to 8-hour snapshots | Fade extreme positive funding (short bias) or ride persistent negative funding in trending regimes |
| Open Interest | Futures (crypto, commodities, indices) | Total outstanding derivative contracts — builds show participation growth | Daily | Rising OI with price up confirms trend; falling OI on rally suggests weak participation — consider caution |
| Put/Call Ratio | Options on equities, indices | Relative bearish vs bullish option volume / interest | Intraday to daily | Very low ratio = complacency (contrarian sell signal), very high = panic (possible bottoming) |
| Retail Positioning (broker data) | Forex, CFDs, crypto (broker-level) | Percentage of retail traders long vs short | Daily to weekly | Heavy retail crowding often precedes mean reversion; treat extreme crowding as contrarian clue |
| Social Sentiment / Mentions | Crypto, meme-stocks, high-profile FX moves | Volume and polarity of social chatter, strong attention spikes | Real-time to daily | Explosive positive mentions = likely short-term euphoria; align size and stop placement accordingly |
Funding Rate: Perpetual swap periodic payment between longs and shorts on crypto exchanges.
Open Interest: Sum of open derivative contracts that reflects trader commitment.
Put/Call Ratio: Volume or open interest of puts divided by calls, used to gauge bullish/bearish bias.
Retail Positioning: Aggregated client exposure reported by brokers; shows crowd direction.
Social Sentiment: Quantified mentions and polarity from social listening platforms.
Behavioral rules and risk management
- Position sizing by conviction:
- Start with a base risk per trade (e.g., 0.5%–1% of equity).
- Increase size only when multiple independent signals align (sentiment + OI + price structure), capped at 2–3x base risk.
- Reduce size when signal relies solely on social sentiment or retail positioning.
Bold sizing discipline: Never exceed pre-defined max drawdown per strategy.
Avoid leverage euphoria: When funding rates are extreme and social sentiment is frothy, cut leverage by 30–70%.
Rule for reversion vs trend-following: If OI falls on a price rally, treat move as weak and favor mean-reversion; if OI and volume rise with price, prefer trend-following overlays with wider stops.
Use stops that adapt to volatility — ATR-based sizing helps keep risk constant while preventing over-tight exits. Practical check: when sentiment flips rapidly, close partial position first rather than scaling in.
Reading sentiment well reduces false entries and keeps capital safe during crowd-driven spikes. Apply these signals together and let position size reflect confidence — that combination protects capital and turns mood swings into repeatable edges.
4. Combining Signals: A Step-by-Step Workflow
Combining signals efficiently means turning a cluttered dashboard into a clear yes/no decision. Start by separating what drives your market bias from what times entries and exits. Primary signals set the trade’s direction and risk appetite; secondary signals refine timing and conviction. When they disagree, the workflow below shows how to weigh, resolve, and act without paralysis.
Primary signal: Broad directional inputs that determine trade bias (e.g., macro trend, higher-timeframe structure, interest-rate expectations).
Secondary signal: Tactical confirmations used for entries/exits (e.g., lower-timeframe price action, short-term momentum, order flow).
Signal Hierarchy and quick rules:
- Highest weight: Macro bias and position sizing rules
- Medium weight: Higher-timeframe technical structure (daily/4H)
- Lower weight: Intraday indicators and sentiment overlays
- Override rule: If a primary signal contradicts a secondary by >2 levels of confidence, treat as “no-trade” unless position sizing reduces risk to acceptable levels
Trade checklist matrix showing requirement, why it matters, pass/fail columns and suggested action if failed
| Checklist Item | Why it Matters | Pass Criteria | If Failed - Action |
|---|---|---|---|
| Macro bias aligned | Ensures trade is with larger trend, lowers drawdown risk | Trend on daily/weekly confirms direction | Wait or switch to counter-trend smaller size |
| No major scheduled news | Avoids event-driven volatility spikes | No high-impact releases within 6–12h | Reduce size or move stop to HOD/LOD |
| Technical entry validated | Confirms logical price entry and structure | Clear support/resistance or breakout with volume | Recalibrate entry or skip trade |
| Sentiment not extreme against trade | Extreme sentiment often triggers reversals | Sentiment indicators neutral-to-favourable | Reduce exposure or wait for fade |
| Acceptable position size | Controls risk-to-reward and drawdown | Position <= max % equity risk rule | Recalculate size or decline trade |
- Identify macro bias and mark direction on daily/weekly charts.
- Run the 10-point pre-trade checklist:
- Trend alignment confirmed on daily/weekly.
- Economic calendar checked for high-impact events.
- Liquidity window acceptable for desired size.
- Support/resistance levels mapped.
- Momentum (RSI/MACD) not overbought/oversold vs bias.
- Order flow or tape shows participation in direction.
- Sentiment indicators (COT/retail skew) neutral-to-favourable.
- Correlation with other markets not conflicting.
- Position size within risk limits (
% equityorATR-based).
- Exit plan (stop, target, time stop) predefined.
- If all critical items pass, use a secondary signal (e.g., a pullback to S/R,
4Hmomentum shift) to time entry.
- Execute with predefined stop and sizing; log rationale and all signal states.
Case Study: A Trade from Start to Finish A EUR/USD short when daily trend was down, macro PMI releases weakening, and daily resistance held.
Entry: Waited for a 1H bearish engulfing candle at resistance that coincided with increased ask-side volume. Size & Risk: 0.8% equity risk, stop above recent swing (ATR-based). Outcome: Target hit for 1.6R in 36 hours. Post-trade lessons: Price respected macro bias; the intraday momentum confirmation sped execution. Improvement: tighten post-entry monitoring when correlated USD moves amplify volatility.
Combining signals this way converts subjective impressions into disciplined choices and measurable outcomes. It keeps risk under control while letting the best signals—macro bias and position sizing—lead the decision.
5. Tools, Data Sources and Platforms
Start with the platforms that actually move decisions: price feeds, charting, on-chain analytics, backtesting engines and economic calendars. Combine a reliable real-time feed, a flexible charting/indicator environment, and a reproducible backtest system — and you’ll turn intuition into repeatable trades. Below are recommended tools, how they’re typically used, free alternatives when appropriate, and quick setup tips that get you trading or analysing within a session.
Recommended Tools and How to Use Them
Resource table showing tool, category, free/paid, primary benefit and quick setup tip
| Tool | Category | Free/Paid | Primary Benefit | Quick Tip |
|---|---|---|---|---|
| TradingView | Charting / Alerts | Free tier; Paid plans available | Powerful charts, Pine Script for custom indicators | Start with free plan, save one watchlist per instrument, build a 3-indicator template |
| MetaTrader / MT5 | Broker terminal / Execution | Free platform; broker fees apply | Order execution, EAs for automation, multi-timeframe features | Use demo account, test simple EA on MT5 before live deployment |
| CoinGecko / CoinMarketCap | Crypto price & market data | Free | Broad market coverage and historical price snapshots | Use API for quick symbol lookup and market-cap screening |
| Glassnode / Nansen | On-chain analytics | Free tier; paid tiers for advanced metrics | Wallet flows, exchange inflows, on-chain signals | Track exchange netflows and large wallet activity for divergence signals |
| Economic Calendars (Forex Factory) | Macro events / Calendar | Free | Immediate view of macro risk events and expected impacts | Filter by impact level and local time; set alerts for NFP, CPI |
| Binance (API) | Exchange / Market data | Free account; trading fees apply | High-liquidity order books and REST/WebSocket APIs | Use testnet for API integration and simulate fills before live |
| QuantConnect | Backtesting / Algo platform | Free tier; paid cloud compute | Research notebooks, live brokerage connectors | Clone a sample algo, run walk-forward tests on 1 year of data |
| Python / pandas / backtrader | Data analysis / Backtesting | Free, open-source | Full control over data pipelines and custom metrics | Keep a requirements.txt, standardise timestamps to UTC |
| Yahoo Finance / Alpha Vantage | Market data (equities, FX) | Free tier; API rate limits | Easy historical price pull for quick screens | Cache API responses and normalise CSV columns for speed |
Practical setup starts small: pick one charting tool, one reliable data API, and a backtest framework. That combination gives a fast feedback loop between idea, historical test and live execution. Keep your stack lean so you spend more time testing strategies than debugging integrations.
6. Risk Management and Performance Review
Start by treating risk management as the trade that never closes: position sizing and stop placement govern whether a strategy survives long enough to show its edge. Good position sizing keeps losses small and performance review turns every trade into feedback for the next one.
Position Sizing
Position Sizing: Choose a stake so a single loss won’t damage the account. Common approaches include fixed-percentage sizing (e.g., 1% of equity per trade) and volatility-adjusted sizing using ATR to size positions relative to market noise.
- Fixed-percent sizing: Stake equals a fixed percent of current equity; simple and psychologically stabilising.
- Volatility sizing: Adjust the lot so stop distance equals
k ATR; keeps dollar risk steady across instruments. - Fractional Kelly (practical): Use a fraction (e.g., 25–50%) of the
Kellysuggestion to limit ruin risk.
Stops and Drawdown Control
Stop Loss: A predefined price level to exit a losing trade; set to reflect both the setup and market volatility. Maximum Drawdown: The largest peak-to-trough decline allowed before pausing or re-evaluating the system.
- Determine your per-trade risk cap (example:
1%equity).
- Calculate stop distance using volatility (e.g.,
2 ATR(14)).
- Compute position size so that
position_size * stop_distance = risk_cap.
- Set a hard maximum drawdown rule (example: stop trading for 2 weeks if DD >
8%) and a contingency plan.
- Risk layering: Reduce position sizes as drawdown deepens.
- Diversification limit: Cap correlated exposures to prevent simultaneous hits.
Post-trade review template table with field, purpose and example entry
| Field | Purpose | Example Entry |
|---|---|---|
| Date / Pair | Timestamp and instrument for tracking | 2026-01-05 / USDNGN |
| Setup Description | What triggered the trade (pattern, signal) | Breakout above 200 EMA after consolidation |
| Entry/Exit | Exact entry, stop, and exit details | Entry 460, Stop 448, Exit 478 |
| Risk/Reward | Money risked vs potential/realized reward | Risk 1.0% → Reward 1.6% (R=1.6) |
| Lesson / Action Item | What to change, test, or keep | Tighten entries on false breakouts; backtest filter |
Turn reviews into strategy changes by batching lessons weekly, running small tests on proposed fixes, and only scaling changes after positive backtesting and forward testing. Keep the feedback loop short: record, score, hypothesize, test, implement.
Treating risk rules and reviews as iterative work keeps a trading plan resilient and adaptive; over time that discipline, more than any indicator, preserves capital and grows edge.
7. Quick Reference / Cheat Sheet
One clear line for trade decisions: Trend + Structure + Liquidity + Risk = Trade edge.
A one-page signal hierarchy (one line): Higher-timeframe trend → Confirming lower-timeframe structure → Clean liquidity/level → Favorable risk-reward → Manage size and correlation.
Top 10 pre-trade checks
- Trend alignment: Higher timeframe trend confirms the intended direction.
- Structure: Recent swing highs/lows and market structure support the setup.
- Liquidity zones: Orders cluster or stops are accessible; watch previous highs/lows.
- Event risk: No major economic releases inside the trade window.
- Correlation: No heavy correlation exposures (e.g., USD pairs moving together).
- Spread and execution: Spread and liquidity at the broker are acceptable.
- Risk-reward: Minimum
R:Rmeets your rule (typical floor1:2for trades). - Volatility: ATR or implied volatility fits the strategy’s tolerance.
- Position overlap: Existing positions don’t create unintended exposure.
- Psychological readiness: The plan is set and emotions are within control.
Position sizing quick rules
- Define risk per trade.
- Calculate raw position size.
Formula: Position Size (units) = (Account Equity Risk%) / (Entry Price - Stop Price)
- Adjust for pip/value.
Step: Convert units to lots based on instrument contract size and pip value.
- Cap aggregate exposure.
- Use volatility scaling.
Practical examples and micro-rules
- Example: On a $10,000 account, 0.5% risk → $50 risk. Entry 1.2000, stop 1.1950 → 50 pips. Position =
50 / 50 pips = $1 per pip(adjust to lot size). - Micro-rule: Round position sizes to broker-allowed increments and never trade fractional micro-lots below minimum.
Tools and quick aids
- Position-size calculator: Keep a spreadsheet or phone app with the
Account Risk% / (Entry-Stop)cell. - Monte Carlo check: Run a quick scenario to see drawdown probability when sizing multiple correlated trades — a service like NairaFX’s Monte Carlo simulation can help.
Keep this sheet on a sticky note or desktop; it’s the fastest way to stop impulsive sizing errors and trade with consistent, measurable risk.
8. FAQ and Common Trader Questions
Beginners and intermediate traders ask the same practical questions over and over: how much to risk, which timeframes work, how to handle news, and when a losing streak becomes structural. The answers below are concise, action-oriented, and aimed at improving decision-making across forex, equities, and crypto.
- What percentage of my account should I risk per trade?
- Rule of thumb: Start at
0.5%if learning, move toward1%once your edge and consistency improve. - Practical step: Size position by distance to
stop-loss, not by conviction. That keeps drawdowns manageable.
- Which timeframe should I trade?
- Short-term (scalping/day): requires tight
stop-loss, fast decisions, and lower capital per trade. - Swing/position: better for part-time traders and carries lower transaction costs; aligns well with macro themes.
- How do I protect against major economic news?
- Before release: reduce position size or close positions with thin liquidity.
- During release: avoid adding new positions until the market stabilizes and spread behavior normalizes.
- When should I cut a losing strategy?
- Diagnostic checklist: trade a minimum of 200–500 trades or a full market regime cycle before declaring failure.
- Refine with: walk-forward testing or Monte Carlo simulation to assess robustness.
- How do I know my edge is real and not curve-fitting?
- Practical tests: out-of-sample run,
k-foldor walk-forward, and randomizing entry dates to check sensitivity.
- How to manage mental stress during drawdowns?
- Daily routine: log emotions, enforce a cooling-off period after large losses, and review trade journal entries objectively.
- Which tools should I prioritize?
- Helpful tools: quality historical data, execution-ready charts, and a Monte Carlo engine for strategy stress-testing. Nairafx’s Monte Carlo simulation offering is designed for traders who need realistic worst-case evaluations and scenario planning.
Practical answers reduce paralysis: sizing by stop-loss, testing out-of-sample, and planning around news are small changes that prevent big mistakes. Keep testing, keep a clean journal, and let risk rules carry you through inevitable losing streaks.
9. Resource Compilation
For traders operating in volatile markets, a compact, reliable toolkit of data feeds, analytics platforms and reference reading cuts hours off research time and reduces guesswork. Below are high-value resources categorized by purpose, with quick notes on cost and how each fits a Nigerian trader’s workflow.
- Market screens and charting: fast visual confirmation of setups and multi-timeframe context.
- On-chain & crypto analytics: behavioral signals and liquidity flows that complement price action.
- News and macro calendars: economic event risk management and headline tracking.
- Broker/terminal tools: execution, backtesting and platform reliability for local access.
Comprehensive resource table that readers can use to build their toolset quickly
| Resource | Category | Free/Paid | Why Useful | Notes for Nigerian traders |
|---|---|---|---|---|
| TradingView | Charting / Screener | Free tier / Pro from $14.95/mo | Best-in-class charts, custom indicators, social ideas | Works well with local brokers via web; use alerts instead of constant monitoring |
| Glassnode | On-chain analytics | Free tier / Advanced from $29/mo | Detailed blockchain metrics (flows, reserves) | Valuable for crypto allocations; subscribe during volatile periods |
| Nansen | On-chain analytics / NFTs | Paid (plans start ~$99/mo) | Wallet labels, smart money tracking | High value for identifying whale activity; consider trial before committing |
| Bloomberg Terminal | News / Macro / Data | Paid (enterprise pricing) | Comprehensive market news, deep data feeds | Expensive; useful for institutional-level research, not retail |
| Reuters (Eikon) | News / Data | Paid (enterprise pricing) | Fast global newswire, market-moving headlines | Cheaper data bundles sometimes available via local vendors |
| ForexFactory | Economic calendar / Forum | Free | Clean economic calendar and community threads | Use calendar to manage Naira-sensitive FX events |
| CoinGecko | Crypto data / Market metrics | Free / API paid tiers | Broad crypto coverage, token metrics | Free API limits apply; good for quick checks |
| CryptoCompare | Crypto market data / API | Free tier / Paid API | Historical and realtime market data | Useful for strategy backtests with cleaner historical ticks |
| Investing.com | Charts / Calendars | Free / Premium $9.99/mo | Combined charts, economic calendar, news | Lightweight alternative to paid terminals; localised news available |
| MetaTrader 4/5 | Execution / Backtesting | Free with brokers | Standard for retail FX trading and EAs | Many Nigerian brokers provide MT5; test execution latency first |
For Nigerian traders, the sensible path is starting with free tiers for charting and calendars, then adding one paid data source for either on-chain or macro depth as strategies scale. Investing a small portion of research budget in reliable feeds pays off through fewer blind trades and clearer risk decisions.
Conclusion
Volatility becomes manageable when technical setups, fundamental context, and market sentiment stop competing for attention and start reinforcing a single decision. The article showed how trend and momentum filters, news-driven fundamental checks, and a sentiment overlay can be combined into one repeatable workflow, and how a disciplined review of trade performance closes the loop. Remember the workflow example earlier where a potential break trade was avoided after the news filter flipped the signal — that’s the kind of simple cross-check that saves capital and preserves confidence. Use the quick-reference cheat sheet to make those checks routine rather than optional.
Take three concrete steps today: 1) codify one combined signal rule and paper-trade it for 30 sessions, 2) set a fixed risk per trade and an end-of-week review ritual, 3) add a sentiment or news filter to every technical setup before sizing a position. For practical tools and curated market data that speed implementation, explore the trading resources at NairaFX. If questions arise about adapting any of the techniques to your time frame or asset mix, revisit the performance-review section and iterate—small, measurable changes compound faster than big, uncertain gambles.