

Can a strategy that made money in backtesting still lose badly if live trades happen in a different order?
This question is important for Nigerian traders handling USD/NGN risk, broker fees, and costly power outages.
A steady equity curve may hide losing streaks that feel much worse when real naira is at risk.
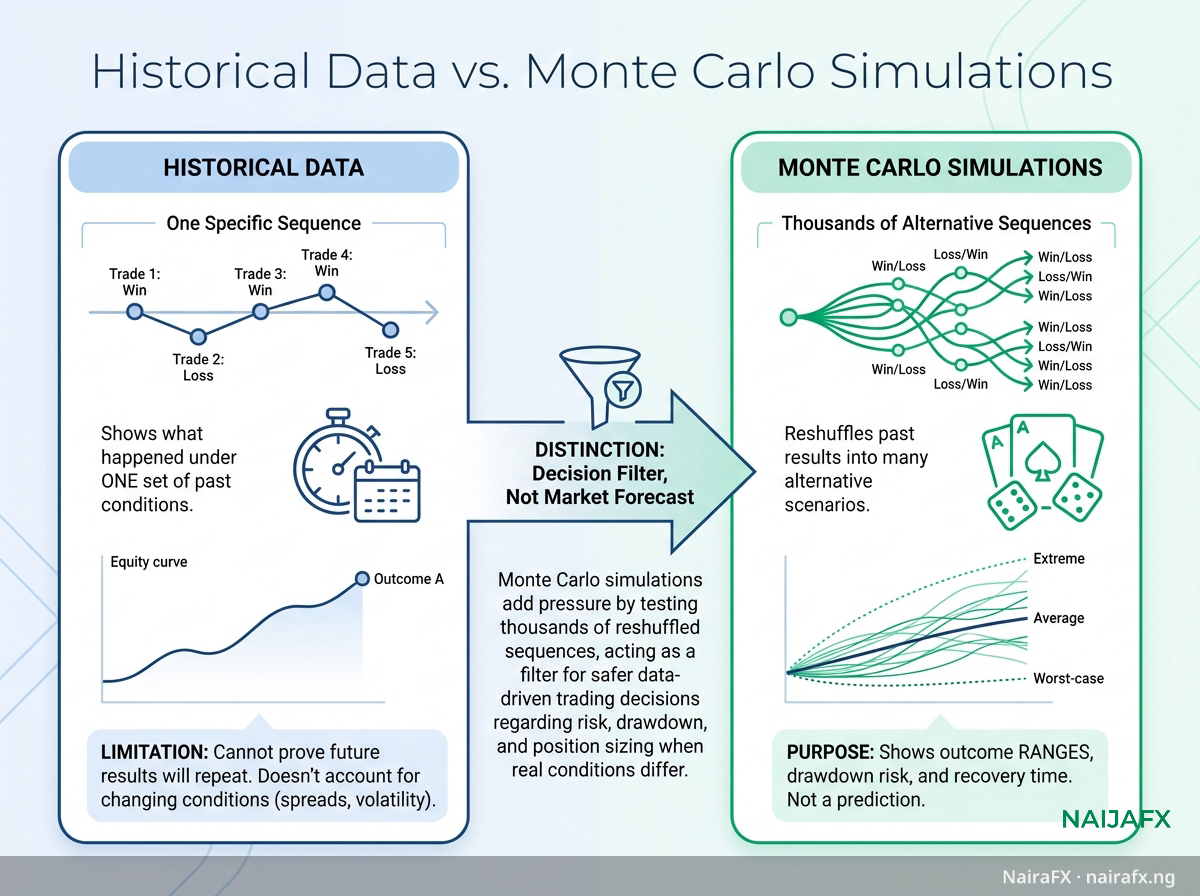
Historical data shows one specific order of market events and trades. It can’t prove those results will happen again, especially if spreads, slippage, volatility, or trade execution change.
Monte Carlo simulations boost the test by shuffling past results into thousands of different sequences. They don’t predict future market moves. Instead, they show how drawdowns, ruin risk, and recovery time might change if trades come in a different order.
This difference is important in data-based trading. A strategy might be profitable on average but still be bad for a small account if costs, position size, and a long losing streak combine.
Quick Answer: Monte Carlo simulations reshuffle historical trade data into thousands of alternative sequences—often 10,000 paths—to see how different trade orders affect outcomes like drawdowns and ruin risk. This reveals a strategy’s strength beyond a single backtest by estimating how results might vary under different market and cost conditions. That’s crucial for Nigerian traders handling USD/NGN exposure and fees.
What Historical Data Means in Monte Carlo Simulations
Can a backtest that made money earn real money if it used only one trade order? Historical data gives evidence, not a final answer. Monte Carlo simulations take past prices or finished trades and reorder them into different sequences. The results show how drawdowns, losing streaks, returns, and risk of ruin might change.
A backtest is one path; Monte Carlo testing tries the same conditions in new orders. It does not predict the next path. Instead, it tests if a strategy can handle bad sequences. Three data types matter:
Market history: Records of price, spread, volume, and volatility. These help check how an EA or rule did under different conditions.
Trade history: Real entries, exits, profits or losses, position sizes, and trade order. This usually forms the equity curve.
Account history: Deposits, withdrawals, fees, swaps, currency changes, balance changes. For Nigerian traders, this shows how broker fees and NGN funding affect usable money.
Simulations can show if results depend on one lucky order of wins and losses. They also reveal max drawdowns and result ranges across thousands of shuffled paths. Some tools run 10,000 sequences, each with 100 to 500 trades.
This has limits. Reshuffling assumes past behavior stays relevant while markets can change due to news, liquidity, spreads, and delays. Historical data cannot prove future profits, steady broker terms, or safe live NGN trading. Document your assumptions and use enough varied trades.
Our backtesting guide suggests at least 30 trades as a base number, not a sure thing.
Why Historical Data Matters to Nigerian Forex Traders
A strategy that looks good can fail if live conditions change. Historical data tests if results hold up across different trade orders, costs, and account pressures—not just if the final percentage looks good. A 30% return might rely on low spreads, perfect fills, or a drawdown too large for a trader’s NGN budget. Entry time, exit price, spread, commission, slippage, losing streaks, and max drawdown give Monte Carlo simulations useful data.
A signal buyer can check published results against account statements or full trade logs. An EA tester can reshuffle trades and raise costs. An educator can use these records to show students a backtest is evidence, not a promise.
Historical data as a shared language
| Audience | Main decision | Useful historical record | Risk question | Warning sign |
|---|---|---|---|---|
| Signal buyer | Should I test a signal service more? | Entries, exits, stop losses, targets, and missed trades with dates | Could fees, spreads, or slow execution remove the advantage? | Showing only winning trades or hiding losses |
| Forex educator | Does the strategy teach good risk control? | Trade order, drawdown, risk per trade, market conditions | Would students survive the worst losing period? | Only looking at win rates |
| EA or algorithm trader | Is an automated system ready for real testing? | Tick/candle data, fees, rejected orders, equity curve | Can it handle wider spreads or slower fills? | Results depend on one broker or time period |
How Historical Data Powers a Monte Carlo Simulation
Historical data is useful only after cleaning and matching it to your strategy. Remove duplicate trades, skipped signals, impossible fills, and results from times when trading was not possible. A signal service, EA, or manual method should provide a full trade record: entries and exits, trade direction, position risk, spread, commission, swap, and market session. Mixing clean backtest trades with estimates can make the simulation look safer than it really is.
This process turns past results into different trade paths. A simulator reshuffles recorded outcomes, making many possible sequences while keeping the same win-loss behavior. Sometimes it models price changes using drift and volatility to create future price paths.
Think of the original backtest as one route through a city. Monte Carlo testing sends the same vehicle through different traffic jams. The vehicle does not change, but arrival time, fuel used, and delay risk may change a lot.
Look at the range of results, not just one good equity curve. Check median returns, max drawdowns, losing streaks, confidence ranges, and chance of ruin. A strategy may make money on many paths but still cause a drawdown too big for your NGN budget. That matters more than the best path.
Include trading costs in the model. Recalculate each trade after spread, commission, swap, slippage, and currency conversion. Nigerian traders should test higher execution costs during power cuts, news, or low liquidity instead of assuming every order fills at the quoted price.
For an EA, platform settings matter but do not replace good data. MT5’s multi-threaded tester allows bigger tests than MT4’s single-threaded one, but neither can fix bad or missing historical data.
The simulation is a stress test, not a promise. It shows if the strategy still fits your account, costs, and risk level when trade order changes.
Examples, Misconceptions, and Data Quality Traps
The same list of trades can tell different stories depending on the context. A signal service might show the same entry and exit points for two Nigerian traders, but their results differ because spreads, commissions, slippage, delays, and position sizes vary. One trader might get a signal during an internet outage and enter late; another might trade during wider spreads around big news.
Monte Carlo simulations can reshuffle recorded trades, but they can’t fix missing costs or recreate missed entries.
Expert Advisors have a similar problem. An EA backtest might use clean data, ideal fills, and the broker’s stated spread. Live trading may have requotes, varying spreads, server lags, swaps, and time differences. The equity curve reflects the test environment, not every broker’s live conditions.
A profitable historical data set doesn’t prove future profit, and Monte Carlo testing can’t predict the next market moves. It shows how past outcomes might change under different orders and assumptions.
Preparing data before simulation
| Do | Why it matters | Don’t | Likely result |
|---|---|---|---|
| Record spreads, commissions, swaps, and slippage | Shows real trading costs | Test only gross returns | Net results look too good |
| Separate in-sample and out-of-sample trades | Limits fitting to past data | Mix all trades | Strategy looks stronger than real |
| Check timestamps and missing trades | Keeps true trade order | Assume every signal ran | Drawdown and streak risks get distorted |
| Test low, average, and high costs | Shows how costs affect results | Use only one fixed spread | Small changes might ruin the edge |
| Compare live or demo results | Checks if execution assumptions hold | Treat simulation as certain | Real fills may differ greatly |
Our backtesting guide says to document assumptions first.
Clean data makes Monte Carlo results more useful but not guaranteed; careful live or demo testing checks if assumptions hold.
How to Apply the Results to Safer Trading Decisions
Monte Carlo results help when they change your trading choices. A wide drawdown range should affect how big your positions are, how much money you put in, and when you pause trading to review. For an NGN account, convert the worst credible drawdown from the simulation into naira. Then ask if that loss would hurt your ability to pay rent, run your business, or pay for electricity and internet. If yes, the strategy is too risky for your account, no matter the average return.
Check three things:
- Broker costs: Did the test include spreads, commissions, swaps, slippage, and delays?
- Signal services: Do the published trades match your broker’s fills, hours, and account currency?
- Expert advisors: Can the EA handle rejected orders, widening spreads, connection loss, and sudden volatility?
Let the simulation guide your limits, not give you a green light. Don’t trade live if inputs are incomplete, trade samples too small, or cost assumptions unrealistic. A polished probability can’t fix missing trades or impossible fills.
Before trusting a report, ask:
- What historical data and rules made the inputs?
- Were losses just reshuffled or were costs changed too?
- How many paths and trades did the test include?
- Does the report show median, bad-case, and max drawdown results?
- Can the author share assumptions and the original trade log?
Our market guide sees scenario testing as part of risk math, and our forex guide stresses testing worst-case equity paths before risking money.
Use results to reduce risk, set review points, and decide when to stop. That’s data-driven trading: no guarantees, but better decisions under stress.
What are the limitations of Monte Carlo simulation?
Monte Carlo simulations do not predict future market movements and cannot account for changing market conditions like spreads, slippage, or execution delays not present in historical data. They rely on reshuffling past trade sequences, which means results depend on the quality and completeness of historical data. They also cannot correct missing costs or replicate trades missed due to outages or other real-world factors.
What two functions would you use to create a Monte Carlo simulation on historical data?
To create a Monte Carlo simulation on historical data, you first clean and prepare the trade record—removing duplicates, impossible fills, and incomplete trades—and then use a simulation function that reshuffles these trades into thousands of alternative sequences, typically around 10,000 paths, to assess strategy robustness under varying conditions.
Can ChatGPT run a Monte Carlo simulation?
ChatGPT itself cannot run Monte Carlo simulations, as it is a language model designed for text generation and understanding rather than numerical computation or data simulation. Monte Carlo simulations require specialized software or programming environments that handle large-scale data reshuffling and statistical analysis.
What are the advantages and disadvantages of Monte Carlo simulation?
Advantages of Monte Carlo simulation include assessing strategy robustness beyond a single backtest by exploring thousands of trade order permutations and estimating drawdown and ruin risk under varied conditions. Disadvantages include dependence on historical data quality and completeness, inability to predict future market moves, and lack of correction for real-world execution issues like slippage or outages.
How does Monte Carlo simulation use historical data in trading?
Monte Carlo simulation uses historical trade or price data as input by reshuffling the sequence of past trades into thousands of alternative paths. This process estimates how variations in trade order, spreads, commissions, and execution conditions affect outcomes like drawdown and profitability, helping traders evaluate the robustness of their strategies before risking real capital.
Turn Historical Results Into a Trading Decision
Historical data cannot tell you what will happen next.
It can show whether a strategy remains tolerable when identical trades arrive in a different order, spreads widen, or account costs reduce returns.
That distinction turns Monte Carlo simulations from a technical forecast into a practical decision filter.
For example, a backtest may finish profitably, yet a reordered sequence can expose a drawdown too large for your USD/NGN account or electricity budget.
Data-driven trading therefore depends not only on a strong result, but on knowing which assumptions make that result fragile.
Before placing another live trade, rerun your test with verified historical data, realistic spread and commission costs, and several randomized trade orders.
Record the worst drawdown, then set your maximum acceptable risk before funding the account.