
Imagine seeing a strategy that makes great profits, only to lose money in real trading.
This issue often starts when a backtest looks effective, but it doesn’t truly reflect real market conditions.
Imagine seeing a strategy that makes great profits, only to lose money in real trading.
This issue often starts when a backtest looks effective, but it doesn’t truly reflect real market conditions.
Backtesting uses clear trading rules on past price data.
This shows how a strategy might perform in various market conditions.
Make sure your testing environment matches the real situations you’ll face as a trader.
Traders need to use a lot of data and include various market conditions.
This way, you can avoid the false confidence that comes from testing over a short period.
A backtest helps evaluate trading strategies, but it cannot guarantee that past results will happen again.
Backtesting requires careful documentation of all assumptions and expected conditions that affect performance, especially in unstable markets like Nigeria.
Quick Answer: Backtesting trading strategies is essential for evaluating their potential effectiveness, but it cannot guarantee future results.
A backtest should have at least 30 trades and cover different market conditions.
This helps avoid misleading results from lucky streaks.
A profit factor above 1.5 usually indicates a better starting point.
Utilizing advanced techniques like Monte Carlo simulations can further enhance risk assessment and decision-making.
1. What Backtesting Really Tells Us About a Trading Strategy
Can past results tell us if a strategy is worth trading today?
1. What Backtesting Really Tells Us About a Trading Strategy
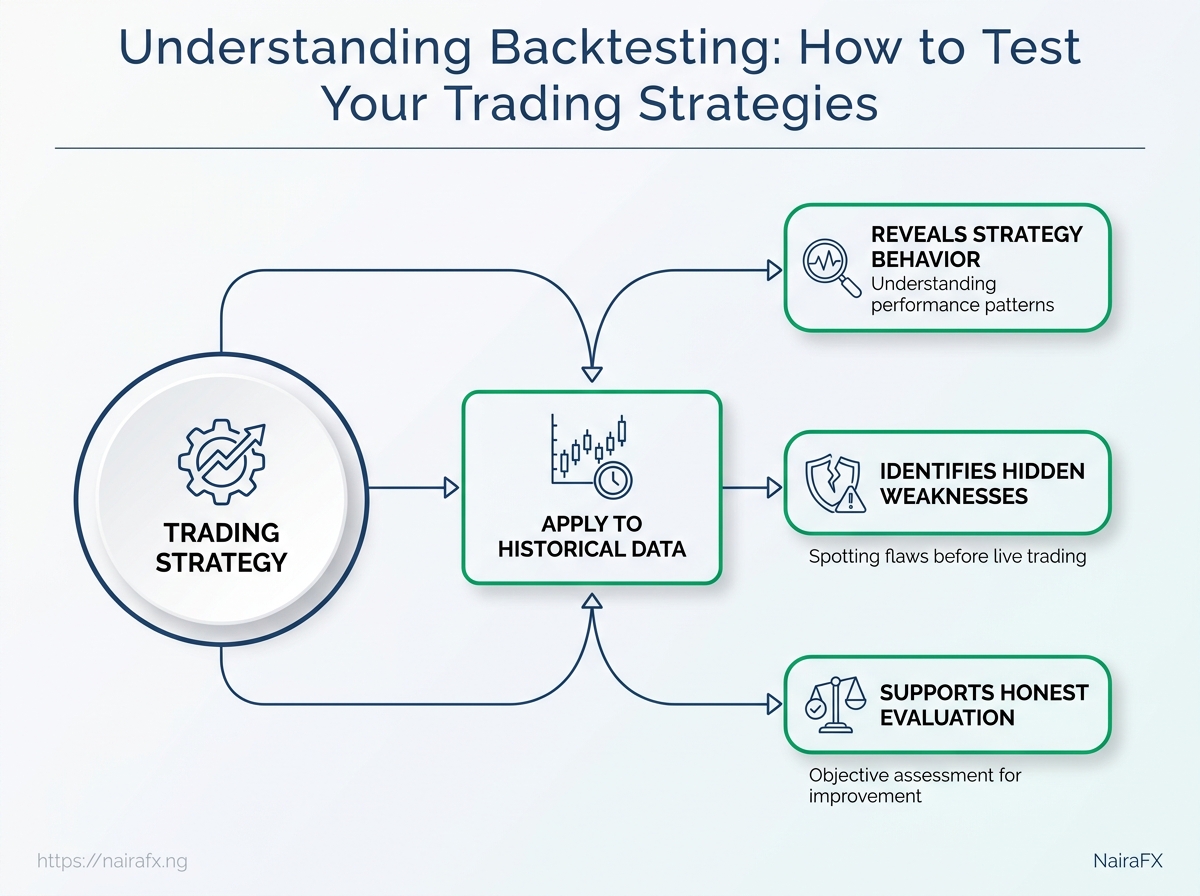
Can past results tell us if a strategy is worth trading today? They can show how the strategy worked in the past, but they cannot guarantee the same result will happen tomorrow.
Backtesting involves applying straightforward trading rules to historical market data.
You decide when to enter, where to exit, how much to risk, and then measure the outcome as though those trades had happened in real time.
Think of it as a driving test on roads you have already travelled.
It helps reveal how the strategy handles different turns, speeds, and hazards.
It does not prove that traffic, weather, or your own decisions will remain unchanged.
A proper test should use enough trades and cover more than one market condition.
Testing only a short period may capture a lucky winning streak rather than a repeatable edge.
Useful measurements include:
- Profit factor: A result above
1.5is often treated as a stronger starting point, although it still requires further testing. - Maximum drawdown: The largest decline from a previous account peak. This shows the financial and emotional pressure the strategy may create.
- Win rate: According to research from www.quantifiedstrategies.com, day-trading strategies often fall between 40% and 60%, so a lower win rate does not automatically make a system poor.
- Trade count: A handful of trades cannot provide reliable evidence. A larger sample gives performance results more meaning.
Backtesting can reveal whether the rules produced profits, how often losses occurred, and which conditions harmed performance.
It can also expose hidden weaknesses, such as dependence on one currency pair, one session, or one trend.
It cannot prove that the strategy will work today.
Historical data may not reflect current spreads, execution delays, liquidity, regulation, news events, or trader behavior.
Fear and greed can also cause live decisions to differ from the tested rules.
The available 2026 research findings report that about 70% of strategies that perform well in backtesting fail during forward testing.
That gap explains why traders should test the system on new, unseen data before committing meaningful capital.
This matters greatly for Nigerian traders.
USD/NGN and other markets influenced by naira volatility can change quickly when liquidity, policy, inflation expectations, or global risk sentiment shifts.
Our Monte Carlo simulation approach for backtesting adds another layer by reshuffling historical outcomes to examine a wider range of possible results.
Backtesting is evidence, not permission to trade.
Use it to decide whether a strategy deserves forward testing, then judge its risks under conditions that history may not have captured.
2. Build a Testable Trading Strategy Before You Test It
A strategy that lacks clarity won’t yield trustworthy backtesting results.
2. Build a Testable Trading Strategy Before You Test It
A strategy that lacks clarity won’t yield trustworthy backtesting results. “Buy when momentum looks strong” leaves too much room for personal judgment, so the results cannot show whether the rules worked or the trader simply interpreted the chart well.
Before backtesting trading strategies, define the market, instrument, timeframe, and exact conditions.
A usable rule should produce the same decision when applied by two different people—or by software.
Risk rules belong in the strategy from the beginning, not after reviewing profitable results.
Record assumptions that matter to Nigerian traders, including USD/NGN volatility, spreads, swap charges, liquidity, execution delays, and any news restrictions.
Turn a Trading Idea into Measurable Rules
The examples below are illustrative rules, not recommendations.
They show how to convert a broad idea into testable instructions.
Table: 2.
Build a Testable Trading Strategy Before You Test It — Strategy element, Questions to answer, Example rule & more
| Strategy element | Questions to answer | Example rule | Common mistake |
|---|---|---|---|
| Market and instrument | Which market and symbols qualify? | Trade only EUR/USD and USD/NGN spot data. | Testing several instruments, then reporting one combined result. |
| Entry conditions | What exact event triggers a trade? | Enter long when the 20-period moving average crosses above the 50-period average at candle close. | Using phrases such as “strong trend” or “good setup.” |
| Exit conditions | When does the trade close? | Exit at the stop-loss, profit target, or after 20 completed candles. | Leaving exits to discretion after entry. |
| Stop-loss and profit target | How are loss and reward measured? | Place the stop at 1.5 times ATR and target 2 times the initial risk. | Changing levels to improve historical results. |
| Position size | How much capital is exposed? | Risk a fixed 0.5% of account equity per trade. | Using the same lot size as the account balance changes. |
| Trading session | When may entries occur? | Open trades only between 8:00 and 16:00 West Africa Time. | Ignoring session changes and low-liquidity periods. |
| News and trading restrictions | Which events pause trading? | Do not open trades within 15 minutes of selected high-impact releases. | Removing losing news trades after seeing the results. |
It also separates the strategy from the assumptions surrounding its execution.
For Nigerian accounts, write down the data source, quoted currency, spread model, commission, swap treatment, and conversion method.
USD/NGN conditions may differ sharply from major currency pairs, so a result based on ideal fills may not reflect live execution.
Our Monte Carlo simulation approach for backtesting can add another layer by reshuffling historical outcomes and examining a wider range of possible paths, especially when volatility is high.
A well-written strategy gives evaluating trading performance a fair starting point.
Test the rules first; judge the results only after every assumption is recorded.
3. Gather Reliable Data and Run a Fair Backtest
Think about two traders trying out the same USD/NGN breakout strategy.
3. Gather Reliable Data and Run a Fair Backtest
Think about two traders trying out the same USD/NGN breakout strategy.
One uses hourly data with realistic spreads and delayed execution.
The other uses clean closing prices and enters at the exact signal price.
Their conclusions may differ sharply, even though the strategy rules are identical.
That difference often comes from the test, not the strategy.
Reliable backtesting trading strategies starts with data that reflects the market, account type, timeframe, and execution conditions you plan to trade.
Match the data to the real market
Historical data should resemble your intended trading environment.
A Nigerian position trader using daily candles needs a different dataset from a day trader trading short-term USD/NGN moves.
Check these details before testing:
- Market and instrument: Use the same currency pair, contract type, and trading session.
- Timeframe: Match the data interval to the strategy’s entry and exit rules.
- Data quality: Check for missing candles, duplicate records, incorrect prices, and inconsistent timestamps.
- Market conditions: Include quiet periods, sharp naira volatility, wide spreads, and major news-driven moves where possible.
A backtest based only on calm conditions may make a strategy appear more stable than it really is.
Monte Carlo simulation can add another layer by reshuffling historical outcomes and examining a wider range of possible results.
Our guide for backtesting trading strategies explains why this approach can be useful in volatile markets.
Price the trade as it would happen
A strategy that earns a small edge before costs may lose money after execution expenses.
Add the spread, commission, swap, slippage, and any minimum distance between the quoted price and the fill.
Also apply practical execution limits:
- Delayed entry: Enter after the signal becomes available, not before.
- Slippage: Test different slippage amounts instead of assuming perfect fills.
- Spread changes: Allow wider spreads during low liquidity or major announcements.
- Order limits: Reflect minimum lot sizes, stop distances, and broker restrictions.
Protect the test from hidden bias
Separate the data used to develop rules from the data used to validate them.
Adjust the strategy on the development period only, then run it once on unseen validation data.
Avoid look-ahead bias by using only information available at each historical decision point.
Data snooping creates a similar problem when traders test many variations and keep only the best result.
Record every meaningful test, including failed versions, so the final result reflects a process rather than a lucky selection.
Fair data, realistic execution, and clean validation make evaluating trading performance far more trustworthy.
Without them, even impressive results may describe an arrangement that never existed in live trading.
4. Measure Trading Performance Beyond Profit
Recent research shows that a strategy can win 70% of its trades but still lose money.
Research shows that five small wins might not balance out one large loss, which is why looking just at win rate won’t give you the full picture of trading quality.
Research from www.goatfundedtrader.com shows that a better evaluation combines profit, risk, consistency, and market exposure.
These measures show whether a strategy has a repeatable edge or simply benefited from a brief period of favorable price action.
Core metrics for evaluating trading performance
Use the same calculation rules for every test.
That makes comparisons fair and exposes weaknesses hidden by a single headline number.
Table: 4.
Measure Trading Performance Beyond Profit — Metric, What it measures, Why it matters & more
| Metric | What it measures | Why it matters | Warning sign |
|---|---|---|---|
| According to www.tradezella.com, net profit shows total gains minus total losses, fees, and other trading costs, illustrating the actual money made or lost. | |||
| Return percentage | Net profit ÷ starting capital × 100 |
Places the result in the context of account size | High return comes with extreme risk |
| Win rate | Winning trades ÷ total trades × 100 |
Shows how often the strategy wins | High rate hides very large losses |
| Average win and average loss | Mean result of winning trades compared with losing trades | Reveals the size and quality of each outcome | Average loss greatly exceeds average win |
| Profit factor | Gross profit ÷ gross loss |
Measures how much profit each unit of loss produces | A result below 1.0 loses money overall |
| Studies suggest that maximum drawdown represents the largest peak-to-trough decline in the equity curve, showcasing the worst historical loss period. | |||
| Expectancy | (Win rate × average win) − (loss rate × average loss) |
Estimates the average result per trade | Expectancy is zero or negative |
| Number of trades | Total completed trades in the sample | Indicates how much evidence supports the result | Very few trades create false confidence |
| Risk-to-reward ratio | Planned or realised risk compared with potential reward | Helps assess whether trade structure supports the win rate | Small rewards require an unusually high win rate |
| Time in the market | Percentage of time capital remains exposed | Shows how much market risk the strategy carries | Long exposure earns little relative to risk |
1.5 is often treated as a useful quality benchmark, but it should never stand alone.
A strategy with a profit factor above 1.5 across only a handful of trades may require further testing before live use.
Read the equity curve and drawdown profile
The equity curve shows how returns arrive, not just where they finish.
A gradual climb with manageable pullbacks usually offers more practical confidence than a final profit created by one exceptional trade.
Mark each peak and the decline that follows it.
Record the depth, length, and frequency of every drawdown.
A strategy that recovers quickly may suit an active trader, while a long flat period can test patience even when the final return looks attractive.
Compare the drawdown with the account risk planned for live trading.
A historical drawdown of 20% could become substantially larger in future conditions, especially when execution differs from the test.
Compare results with a sensible benchmark
A strategy should beat a relevant alternative, not an arbitrary target.
For a currency system, compare its risk-adjusted return with simply holding the account currency or using a passive exposure that carries similar market risk.
Also compare the strategy’s return against its maximum drawdown, time in the market, and number of trades.
A smaller return may be acceptable when the strategy spends less time exposed and experiences much smaller losses.
Separate results by market condition
A single total hides useful detail.
Group trades by trend, range, high volatility, low volatility, and major news periods where those labels can be defined consistently.
This reveals whether the system has one dependable strength or relies on one market environment.
Monte Carlo testing can add another layer by reshuffling historical outcomes and examining a wider range of possible drawdown paths, an approach discussed in our Monte Carlo simulation guide for trading strategy testing.
Profit is the destination, not the whole map.
Strong performance evidence comes from consistent expectancy, survivable drawdowns, enough trades, and results that remain credible across different market conditions.
5. Stress-Test Results Before Considering Live Trading
Could the strategy with the highest return be the least suitable for live trading? Often, yes.
A big historical gain might rely on one market phase, unusually smooth execution, or rules that work only in specific settings.
A stronger backtest survives reasonable changes.
It continues to behave acceptably across different periods, market conditions, and rule settings.
That matters even more when trading pairs affected by sharp naira movements, where spreads, liquidity, and volatility can shift quickly.
Test the strategy’s flexibility
Sensitivity testing changes one rule at a time.
Adjust the entry threshold, stop-loss distance, holding period, or risk per trade, then compare the results.
The goal is not to find the perfect setting.
It is to discover whether small changes destroy the strategy.
A system that works only at RSI = 53 but fails at 52 or 54 may be fitted too closely to historical data.
A healthier system should produce a similar range of outcomes across sensible settings.
Test the strategy across:
- Different time periods: Include quieter, more volatile, and transitional markets.
- Different market regimes: Examine trends, ranges, sudden reversals, and extended drawdowns.
- Different assumptions: Vary spreads, execution delays, commissions, and slippage.
Monte Carlo simulation adds another layer by reshuffling historical trade outcomes and modelling a wider range of possible paths.
Our Monte Carlo simulation guide for trading strategies explains why this approach can be useful when assessing naira-related volatility.
Use forward evidence, not only historical evidence
Walk-forward testing divides the data into an earlier development period and a later evaluation period.
After testing the rules on the first segment, run them on unseen data without changing the system.
Repeating this process shows whether performance holds outside the original sample.
Paper trading comes next.
Record every signal, entry, exit, spread, delay, and emotional reaction as if real money were involved.
This reveals execution problems that historical data cannot capture, including hesitation during losses or missed trades during fast moves.
Set a clear decision gate
Before considering live trading, write the acceptance rules in advance:
- Reject the strategy if results depend on one short period or one exceptional trade.
- Require a profit factor above
1.5only after realistic costs and forward testing.
- Reduce or reject the system if drawdowns exceed the amount you can financially and emotionally tolerate.
- Pause when paper-trading results differ sharply from the backtest without a documented reason.
A strategy does not need the biggest return.
It needs stable behaviour, understandable risks, and evidence that its rules remain usable when conditions change.
That is the standard that makes evaluating trading performance more practical—and live decisions less impulsive.
6. Document the Test So We Can Learn From It
You finish a backtest, see an attractive equity curve, and then face an awkward question: Why did this strategy work? If the answer is just, ‘the results looked good,’ the test has not given you enough information to make a live trading decision.
A useful record explains the conditions behind the result.
It shows which rules were tested, when they changed, what market environment existed, and whether the outcome matched the original expectation.
Without that record, future testing becomes guesswork.
Build a repeatable backtesting record
Treat each test as an experiment rather than a screenshot of past profits.
Record the version of the strategy, the instrument, timeframe, data period, spread assumptions, entry and exit rules, position-sizing method, and any changes made during testing.
A practical record can include:
- Strategy version: Assign a simple label, such as
USDNGN-breakout-v1.2.
- Test conditions: Note the data range, session hours, transaction costs, and execution assumptions.
- Trade evidence: Save every entry, exit, stop-loss, target, reason for taking the trade, and rule exception.
- Market context: Tag periods as trending, ranging, highly volatile, or affected by major news.
- Review notes: Explain what surprised you, what failed, and what remains uncertain.
This structure makes the test repeatable.
Another trader—or your future self—should be able to reproduce the process without relying on memory.
Separate evidence from expectations
Keep two columns in your journal: observed evidence and personal expectation. “The strategy captured several large moves during strong trends” belongs in the first column. “It should continue working because volatility will remain high” belongs in the second.
That distinction matters when evaluating trading performance.
Evidence comes from recorded trades and predefined calculations.
Expectations are hypotheses that require forward testing.
For volatile naira-related markets, a Monte Carlo review can add another layer by reshuffling historical outcomes and examining a wider range of possible sequences.
Our explanation of Monte Carlo simulation for backtesting shows why the order of wins and losses can matter as much as the total result.
Turn records into a controlled plan
A documented test should end with trading limits, not excitement.
Define the maximum risk per trade, the daily loss limit, the conditions that pause trading, and the evidence required before increasing position size.
Also record the strategy’s failure signals.
A rule breach, a large execution difference, or a shift in market behavior may justify stopping the test—not forcing the strategy to work.
Good documentation turns how to test trading strategies into a learning process.
It connects backtesting trading strategies with disciplined execution, making each review more useful than the last.
Frequently Asked Questions
What is the best backtested trading strategy?
A strong backtested trading strategy typically features a profit factor above 1.5 and includes at least 30 trades across various market conditions.
This helps ensure that the strategy is not simply a result of lucky streaks but demonstrates a reliable approach to trading.
How can I effectively test my trading strategies?
Effectively testing trading strategies starts with defining clear, testable rules encompassing market, instrument, timeframe, and conditions.
Use historical data that accurately reflects real market scenarios, including account types and execution conditions, to match the intended trading environment.
What are the key metrics for evaluating trading performance?
Key metrics for evaluating trading performance include net profit, win rate, and risk-reward ratio.
These metrics provide a comprehensive view of profitability, consistency, and risk exposure, helping to identify whether a strategy possesses a repeatable edge or just benefited from isolated favorable conditions.
Why do many traders fail despite backtesting their strategies?
Many traders fail despite backtesting because backtests can be distorted by unrealistic assumptions or market conditions that don’t replicate live trading scenarios.
Additionally, strategies that show strong historical performance may be overly reliant on specific conditions, leading to poor results in real-time trading.
Conclusion
Turn Historical Profits Into Better Trading Decisions
Backtesting trading strategies is not a promise of future profit; it is a way to discover how a strategy behaves under defined conditions.
The most valuable insight is that a convincing equity curve means little when the test ignores spreads, slippage, drawdown, position size, or the realities of trading with naira.
A strategy that looks excellent on a chart can quickly weaken once realistic costs and difficult market periods enter the test.
That is why knowing how to test trading strategies requires more than pressing “run” on historical data.
You need clear entry and exit rules, reliable price history, performance measures beyond total profit, and stress tests that challenge the strategy across different markets and assumptions.
Evaluating trading performance properly also means documenting each decision, so you can separate a genuine advantage from a lucky sequence of trades.
Today, choose one strategy and rerun its backtest with realistic spread, slippage, and position sizing.
Record the total return, maximum drawdown, losing streak, win rate, and results across at least two different market conditions.
Then compare those findings with a small paper-trading sample before risking real capital.
The goal is not to find a perfect strategy; it is to understand whether its risks remain acceptable when the market stops behaving like the chart.
What is the best backtested trading strategy?
The best backtested trading strategy consistently performs well across various market conditions.
It should be thoroughly tested with sufficient historical data to ensure reliability and not just based on short-term results.
How can I effectively test my trading strategies?
To test your trading strategies effectively, use clear trading rules on complete historical price data.
Ensure the testing environment mirrors real market conditions and cover a range of market scenarios to avoid false confidence.
What are the key metrics for evaluating trading performance?
Key metrics for evaluating trading performance include the return on investment, drawdown, win-to-loss ratio, and consistency of profits in various market conditions.
These metrics let you gauge how effective and reliable your trading strategy really is.
Why do many traders fail despite backtesting their strategies?
Many traders fail despite backtesting because the backtest may not accurately reflect real market conditions, leading to misplaced confidence.
Additionally, failing to document assumptions and overfitting strategies to historical data can also contribute to poor real-world performance.