
A trade can look harmless right up until a news spike widens spreads and your stop gets clipped before price even settles.
That is where risk assessment models matter most: they force traders to think beyond direction and price targets.
In Forex risk evaluation, the real question is not just “Will this pair move?” but “How much can it move against us, and at what cost to exit?”
That is why traders keep returning to Value at Risk (VaR), stress testing, and scenario limits.
These trading risk models help put a number on uncertainty, whether the danger comes from volatility, gaps, or a thin market window around major releases.
For forex traders, the best model is rarely the fanciest one.
It is the one that matches account size, leverage, and drawdown tolerance without ignoring execution risk.
A model that looks elegant on paper can still fail the moment spreads expand or emotions push size, stops, and exits off plan.
Quick Answer: Use a risk-model stack that matches the decision you’re making: – VaR (parametric or historical simulation): quantify typical loss for a chosen confidence level. – Expected Shortfall and/or stress testing: understand what happens in tail conditions (when losses cluster). – A sizing rule (Kelly only if you have a stable edge, otherwise a conservative risk-per-trade cap): convert the loss estimate into trade size. – Maximum drawdown: ensure your plan survives the worst equity decline you’re willing to tolerate. When you apply these to Forex, translate “paper risk” into execution-aware risk by using your realistic spread/slippage assumptions—so the model’s loss number matches what your account can actually absorb.
Why Risk Assessment Matters in Forex Trading
A trader can call the direction correctly and still lose money fast.
The usual problem is not the idea; it is the risk attached to the idea.
In Nigeria, that risk shows up quickly on volatile pairs.
Spreads can widen, liquidity can thin out, and a major US release can turn a clean setup into a messy fill.
Risk assessment models help move trading from instinct to structure. Value at Risk, Monte Carlo simulation, historical simulation, and stress testing do not predict the next candle; they estimate how much damage a move could cause under different conditions.
That matters because the market does not only test direction.
It tests position size, stop-loss placement, and account exposure at the same time.
- Value at Risk: VaR estimates a potential loss at a chosen confidence level. CFA Institute’s 2026 reading treats it as a core tool for measuring portfolio risk.
- Historical simulation: This method uses past market moves to estimate how the current trade might behave. It works well when traders want to see how real shocks affected prices before.
- Monte Carlo simulation: This approach runs many possible price paths and shows a range of outcomes. It is useful when traders want to test a strategy across different market patterns, not just one history.
- Stress testing and limits: Stress tests ask, “What happens if the market jumps?” That pairs well with stop-loss limits, risk budgeting, and scenario limits, which keep one trade from taking over the account.
A simple rule keeps the picture clear: if a setup cannot survive a normal loss plus slippage, the trade is too fragile.
That is why many traders cap risk near 1% per trade, while published examples show how risking 15% per trade can leave a trader down nearly 40% after three losses.
For volatile pairs in Nigeria, the real question is not whether the setup looks good.
It is whether the account can survive the worst sensible version of that setup.
At NairaFX, we treat that discipline as the starting point for sound Forex risk evaluation.
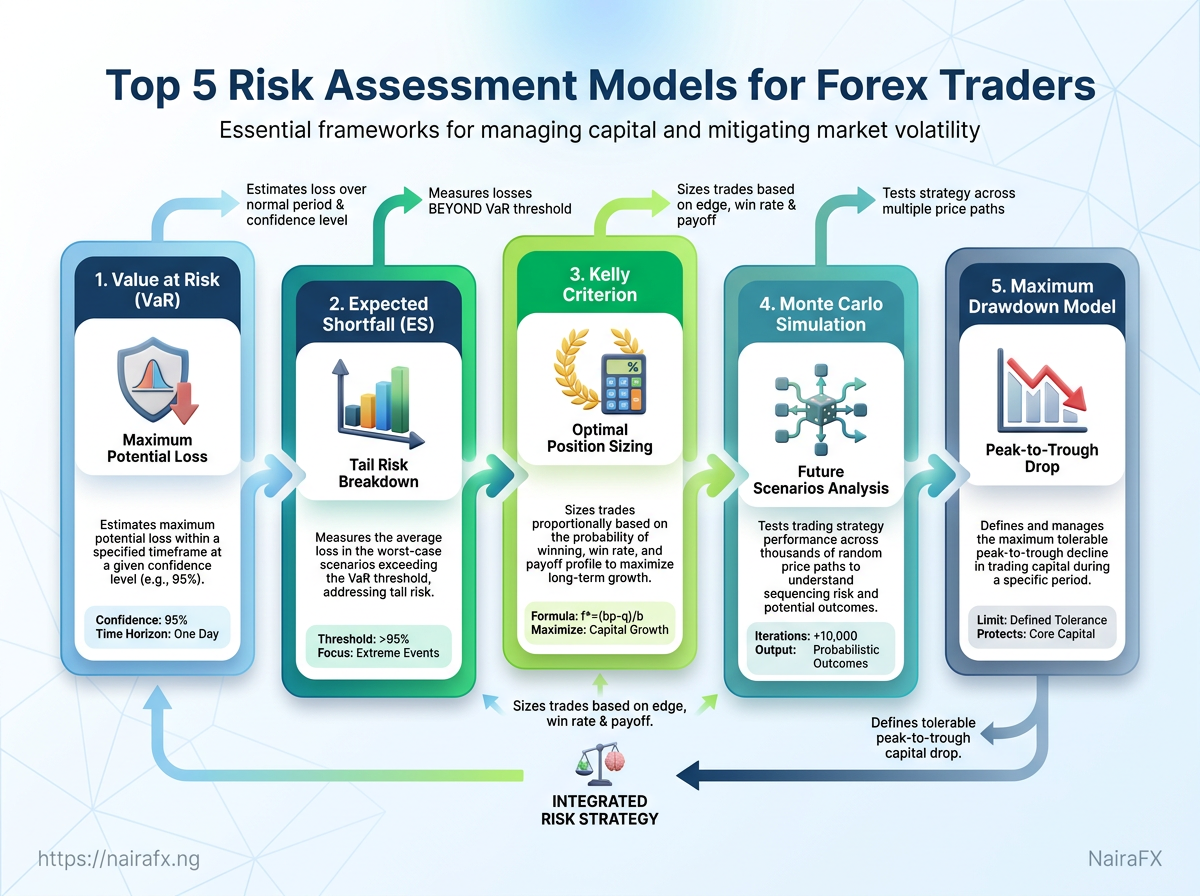
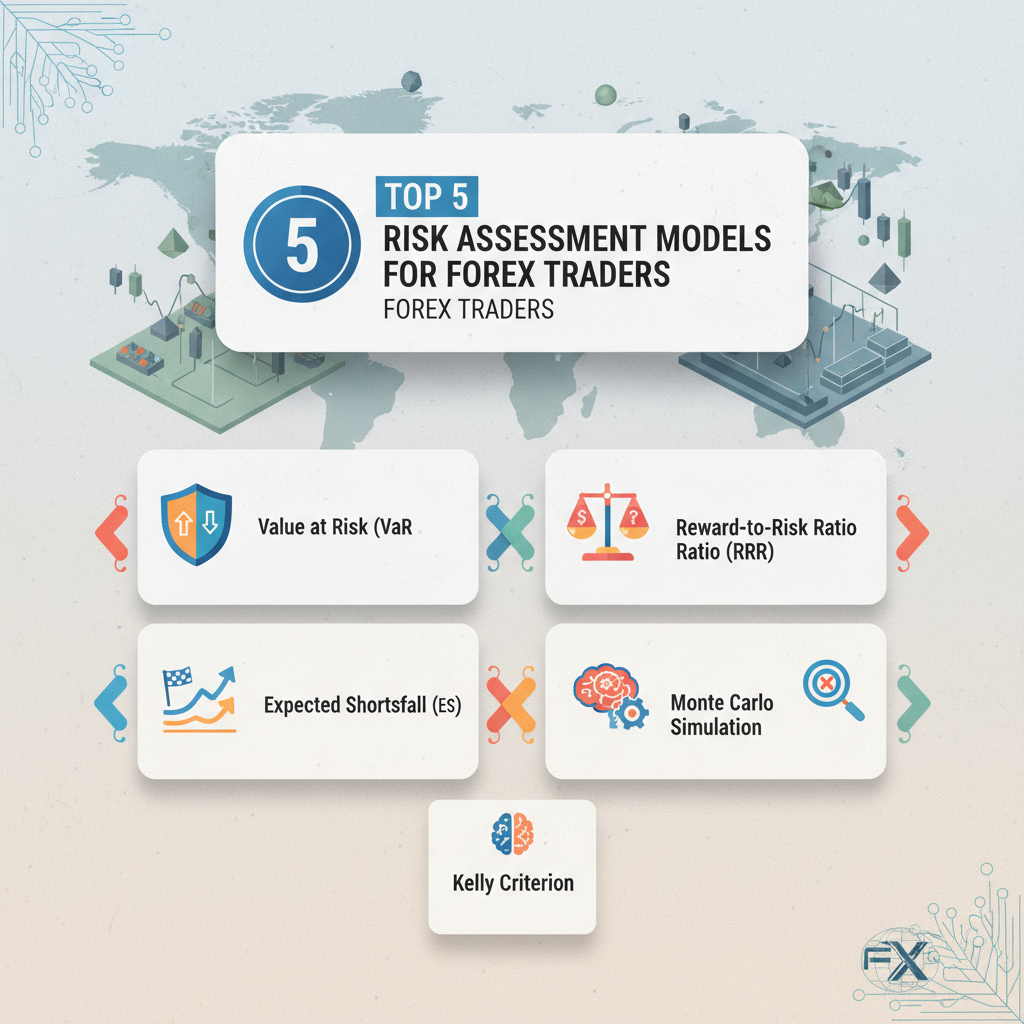
Top 5 Risk Assessment Models for Forex Traders
A trader can survive a bad idea.
What usually hurts accounts is a bad risk model that scales losses too fast.
That is why the best trading risk models do more than guess direction.
They define how much pain a strategy can absorb, how losses behave in ugly markets, and when exposure needs a hard cap.
1.
Value at Risk (VaR): This estimates the most we might lose over a normal holding period at a chosen confidence level.
A simple read is: “Under typical conditions, losses should stay within this range most of the time.”
2.
Expected Shortfall: VaR stops at the threshold, but this model looks beyond it.
It matters when the worst days are not just rare, but clustered and sharp.
3.
Kelly Criterion: This sizes trades around edge, not hope.
It works best when a strategy has a proven win rate and payoff profile, because aggressive sizing can punish weak data fast.
Kelly readiness checklist
| Check Item | Yes/No | Why It Matters |
|---|---|---|
| Backtested win rate | Yes | Kelly needs a real edge, not a guess. |
| Known reward-to-risk ratio | Yes | The formula depends on payout quality. |
| Stable trading edge | Yes | A drifting system breaks the sizing logic. |
| Comfort with aggressive sizing | No | Full Kelly can create deep drawdowns that many traders cannot hold. |
A strategy with 100 or more trades gives a cleaner read than a tiny sample, and that matters more than the excitement of a big theoretical growth rate.
4.
Monte Carlo Simulation: This tests a strategy across many shuffled paths, so we see how it behaves when wins and losses arrive in different orders.
It is useful because two strategies with the same average return can feel very different once sequencing risk shows up.
5.
Maximum Drawdown Model: This measures the worst peak-to-trough drop we can tolerate before the plan changes.
A trader who cannot live through a 20% equity fall should not run a model that regularly produces 35%.
The strongest Forex risk evaluation usually blends all five.
VaR and Expected Shortfall map the loss zone, Kelly shapes position size, Monte Carlo checks path risk, and maximum drawdown keeps the whole plan emotionally survivable.
At NairaFX, that mix matters because a model only helps when it still makes sense on a live account.
How to Choose the Right Model for Your Trading Style
A trader holding EUR/USD for ten minutes is solving a different problem from someone holding a position through next week’s data flow.
That difference matters more than most people admit.
Scalpers need fast, execution-aware rules.
Day traders need a clean loss frame that survives intraday noise.
Swing traders usually need models that respect wider moves, higher volatility, and longer holding time.
Which model fits each trading style
| Model | Best For | Complexity | Main Strength | Main Limitation |
|---|---|---|---|---|
| Value at Risk | Day traders | Medium | Simple loss estimate at a chosen confidence level | Can miss extreme events |
| Historical simulation VaR | Swing traders | Medium | Uses real past market moves | Weak when market regime changes |
| Monte Carlo simulation VaR | Swing traders and advanced traders | High | Tests many possible price paths | Depends on input assumptions |
| Stress testing | Scalpers around news, day traders, swing traders | Medium | Shows damage under rare shocks | Not a probability estimate |
| Risk budgeting and position limits | All styles, especially smaller accounts | Low | Creates hard caps on damage | Does not predict market behavior |
Their edge lives and dies on spread, slippage, and order speed, so the model has to stay simple enough to act on fast.
Day traders often get the most value from Value at Risk plus a stress check before major releases.
Swing traders usually need historical simulation or Monte Carlo simulation because their trades sit inside larger market swings and longer uncertainty windows.
The account itself should also shape the choice.
A smaller account needs tighter rules and less model complexity, while a larger account can absorb more variation without blowing up after a few bad candles.
High leverage and volatile pairs like GBP/JPY or XAU/USD push the choice toward stricter limits, not looser ones.
The table above also shows the most common mistakes.
Traders force one model across every timeframe, size positions before checking spread conditions, or trust a backtest with too little history.
Another classic error is using a model as a prediction tool instead of a guardrail.
That last point causes the most damage.
A good Forex risk evaluation setup turns risk assessment models into rules you can actually follow, not just numbers on a screen.
A consistent risk routine turns risk models from theory into repeatable decisions.
The goal is simple: check the trade before you enter, verify it during the trade, and review outcomes afterward—so mistakes don’t repeat under pressure.
- Run the same pre-trade check every time: confirm the setup, mark the stop, calculate position size using the stop distance, and cap risk as a fixed share of equity. If market conditions change versus your plan (e.g., spreads widen or fills become worse than your assumptions), reduce size or wait—treat it as a guardrail failure, not a signal failure.
- Review the trade after it closes: record whether entry/stop placement matched the plan (and not emotion), whether the model’s risk calculation still held, and whether the exit respected the rule set.
- Review the week, not just single trades: look for recurring patterns like consistent oversizing, repeated rule-breaking around certain times, or losses that correlate with specific market conditions—then adjust the inputs or the guardrails you’re using.
To combine two models without complexity, assign each a clear job: use VaR-style thinking for normal-loss budgeting, and add a stress check for tail conditions around releases or thin conditions. The result is practical: one model sets the limit, the other decides whether the trade deserves smaller size, wider buffers, or no entry.
A clean model can still fail in a messy market—especially when the “risk inputs” your model assumes don’t match how trades actually fill in Nigeria.
In Nigerian trading conditions, the biggest gap is often not the model itself (VaR, historical simulation, Monte Carlo, stress testing), but the assumptions behind the inputs: liquidity depth, typical spread behavior, and the real slippage you experience when the market gets jumpy. If your model is calibrated on neat, stable spreads or smooth fills, its loss estimates can look too optimistic.
Practical ways to adapt models to Nigeria
- Calibrate to your broker’s execution, not just the chart. Use your own recent data for spread ranges and slippage (especially around major releases). Then plug those “execution-aware” costs into your risk calculations so the model reflects what your stop can realistically handle.
- Model the wrong-way fill risk for thin liquidity. When liquidity thins out, stops may not be executed at the “expected” price. Instead of only asking “how much could price move,” also ask “how bad could the fill be relative to my stop distance?” This turns risk assessment into a fill-tolerant guardrail.
- Account for margin and funding realities. With leverage, small disruptions can trigger margin pressure sooner than you expect. Align your sizing logic with how quickly margin stress shows up on your account (and how exchange-rate/margin currency handling affects usable equity).
When a model says “too risky,” use a decision tree
Instead of debating the output, check which assumption broke:- Execution costs changed? If spreads/slippage widened beyond normal ranges, reduce size or wait for liquidity—don’t force the trade through.
- The scenario window is wrong? If your news/holding timeframe is longer than the period used to estimate VaR/stress, re-run the model with the correct horizon.
- Your stop logic is inconsistent with real fills? If the stop distance doesn’t cover realistic slippage, adjust the setup (or skip).
Done well, this is what “Forex risk evaluation in Nigeria” should look like: fewer generic warnings, and more calibration to the exact execution conditions your account faces—so the model’s numbers stay meaningful when the market stops cooperating.
What is the VaR value-at-risk model?
Value at Risk (VaR) is a risk model that estimates the most a trader might lose over a specified holding period under normal conditions at a chosen confidence level. In practical terms, it answers: “Losses should stay within this range most of the time.” For forex, VaR is used to convert uncertainty (like volatility and liquidity shocks) into a measurable potential loss.
What does a 5 3 month value-at-risk VaR of $1 million represent?
A “5% 3-month VaR of $1 million” represents the loss threshold over the next three months such that it should not be exceeded with 95% confidence. Put simply, there’s a 5% chance the portfolio’s loss will be larger than $1 million over that 3-month window. VaR is about the tail risk level at a confidence setting, not a guaranteed maximum loss.
What is the difference between VaR and stressed VaR?
VaR estimates potential losses under typical or “normal” market conditions at a set confidence level. Stressed VaR recalculates potential losses using harsher, crisis-like inputs—such as volatility spikes, spread widening, and liquidity thinning around major news releases—so it reflects what can happen in ugly markets. The key difference is that stressed VaR is designed to be more conservative when normal assumptions fail.
What are the 7 types of risk management?
Seven common types of risk management are risk avoidance, risk reduction (mitigation), risk transfer (hedging/insurance), risk acceptance (retaining the risk), diversification, hedging, and continuous monitoring/control. The goal is to match the tool to the risk source—like volatility, gaps, spreads, or slippage—so losses don’t scale faster than your account can absorb them. Together, these create a structured process for pre-trade checks and exposure limits.
Is $100 enough to start forex?
$100 can be enough to start forex only if your broker allows trading at that minimum and you use strict position sizing so a loss doesn’t damage the account. The main risk with small capital is that spreads, slippage, and stop-loss clipping during news can turn a small setup into a large percentage drawdown. Start by capping risk per trade and calibrating position size to real execution costs, especially around major releases.
The Trade Before the Trade
The real job of risk assessment models is simple: they stop a trade from becoming a guess.
When spreads widen, slippage creeps in, and a clean chart turns messy, solid Forex risk evaluation keeps the damage small enough to recover from.
That discipline matters even more in Nigerian trading conditions, where liquidity, execution speed, and news moves can change fast.
The best trading risk models are not the fanciest ones; they are the ones that match your style, survive a bad week, and protect your equity curve when the market turns rough.
Start today by stress-testing one live setup against a news spike, a wider spread, and a smaller position size.
If that version fails, the model needs adjusting before the next trade, not after the loss; if you want a deeper test, our team can pressure-test the numbers with Monte Carlo simulation and equity-curve review.