

What happens when a profitable trading strategy meets a sudden naira move, a widening spread, or a crypto market that falls sharply overnight? Without a clear risk assessment process, one unexpected move can expose weaknesses that several winning trades had hidden.
Many traders judge risk by asking whether a stop-loss is in place.
That is only one part of the picture.
Position size, leverage, liquidity, correlation, slippage, account currency, and the strategy’s losing streak all shape how much capital remains at risk.
Risk assessment in trading means testing how a strategy behaves before real money faces those conditions.
A method that looks reliable during calm market sessions may struggle when volatility rises or several positions move against you together.
Strong trading strategy risk management also goes beyond choosing a risk percentage.
It connects each trade to the wider health of the account, showing when losses are normal, when performance is deteriorating, and when trading should pause.
For Nigerian traders operating across local and global markets, currency conversion and broker conditions add another layer. Building risk frameworks creates a structured way to measure those pressures, challenge optimistic assumptions, and keep a strategy’s worst periods within a loss level you can genuinely withstand.
Quick Answer: Build a robust trading risk assessment framework by defining specific capital-damaging events (including spread widening, order rejection, and naira moves), estimating their financial impact, and pairing each with a control. Set risk limits ahead of testing, then verify them with evidence-based metrics and stress tests that include volatility spikes, correlation-driven multi-position losses, slippage, and account currency conversion so worst-case periods stay within a loss level you can afford.
Start With a Clear Risk Definition
What can go wrong before a trade is even placed? More than a price moving against you.
A broker may reject an order, the naira may weaken against your account currency, or a poor internet connection may delay execution.
That is why effective risk assessment in trading begins before entry analysis.
We first define the events that could damage capital, then decide how much exposure each event deserves.
A useful risk definition has three parts: the possible event, the financial effect, and the control.
For example, “a sudden spread increase could make the planned stop-loss more expensive” is clearer than simply writing “market risk.”
Separate risk from related conditions
Traders often treat every uncomfortable market experience as risk.
That creates vague plans and weak decisions.
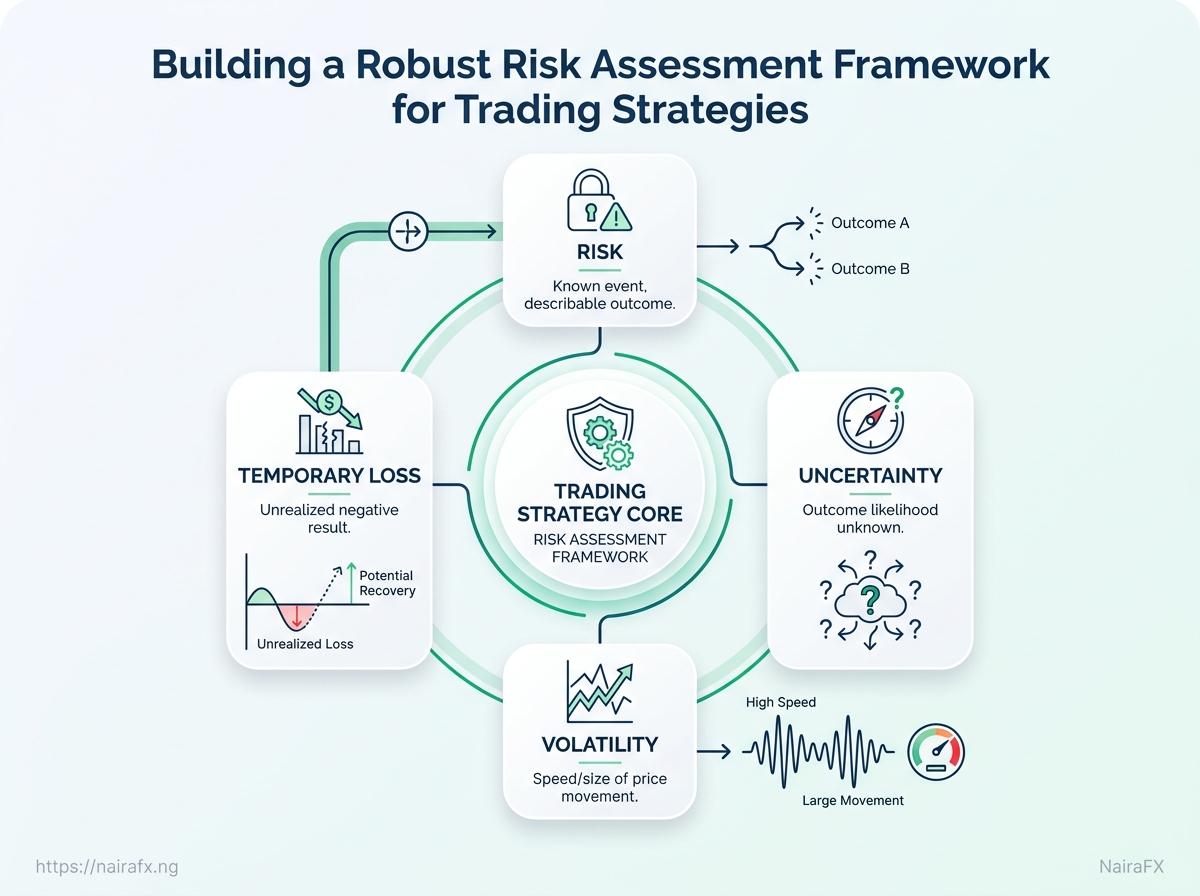
Risk: A known event with a reasonably describable outcome.
A stop-loss may be triggered, or a broker may reject an order during extreme conditions.
Uncertainty: An outcome whose likelihood or effect cannot be estimated confidently.
A surprise policy announcement may affect several markets in different ways.
Volatility: The speed and size of price movement.
Volatility is a market condition, not automatically a loss.
A position can survive high volatility when its size and stop distance are appropriate.
Temporary loss: A position showing a negative unrealised result.
It becomes a realised loss only when closed, although the drawdown still matters for margin and emotional control.
This distinction prevents overreaction.
A trader who labels every temporary loss as “unacceptable risk” may exit sound positions too early.
Another trader who calls a widening spread “normal volatility” may ignore a serious execution problem.
Build a Nigerian risk inventory
A risk inventory turns broad concerns into checks we can act on.
Record each risk beside its trigger, likely effect, and response.
- Market risk: Price moves against the position. Set the invalidation level before entry.
- Strategy risk: The trading method fails in current conditions. Review results across trends, ranges, and high-volatility periods.
- Execution risk: Slippage, rejected orders, or platform delays change the planned entry. Use realistic fills in testing.
- Liquidity risk: Thin trading conditions widen spreads or make exits difficult. Avoid relying on ideal spreads during major announcements.
- Currency risk: A Nigerian trader can lose through exchange-rate changes even when the quoted asset behaves as expected. Track both the trade and the naira value of the account.
- Operational risk: Power cuts, internet outages, or device failure interrupt trade management. Keep backup connectivity and define emergency actions.
- Behavioural and compliance risk: Revenge trading, excessive size, or using an unsuitable broker can damage an account before analysis matters. Include broker verification and position limits in the plan.
A practical framework can assign each trade a maximum loss using position size = account risk ÷ stop distance.
Clear definitions make trading strategy risk management measurable, while a written inventory gives building risk frameworks a practical starting point.
Set Risk Limits Before Testing a Strategy
A strategy is not ready for live trading until its loss limits are written down. Backtests can show attractive returns, but they cannot protect an account from oversized positions, clustered trades, or a long losing streak.
Written limits turn trading strategy risk management into a set of decisions we can test.
Without them, a strategy may appear profitable only because the trader quietly accepts risks that would be unacceptable in live conditions.
The figures below are illustrative, not universal rules.
Your account size, broker conditions, trading timeframe, and tolerance for loss should shape the final limits.
A Practical Risk-Limit Checklist
| Risk area | Suggested limit | Warning signal | Action to take |
|---|---|---|---|
| Risk per trade | Illustrative range: 0.25%–1% of account equity |
Planned loss exceeds the chosen percentage after spread and fees | Reduce position size or widen the testing period before proceeding |
| Maximum daily loss | Illustrative ceiling: 1%–2% of account equity |
Several losses occur in one session, or execution quality declines | Stop trading for the day and review each trade |
| Maximum weekly loss | Illustrative ceiling: 3%–5% of account equity |
Losses continue despite following the written rules | Pause new trades and check whether market conditions have changed |
| Maximum drawdown | Pre-set strategy limit, such as 10%–15% |
Equity falls below the approved peak-to-trough loss | Suspend the strategy and complete a formal review |
| Open-position exposure | Set a combined account limit across all active trades | Total worst-case loss exceeds the approved account risk | Close, reduce, or reject trades that breach the limit |
| Correlation exposure | Cap positions influenced by the same currency or market factor | Multiple trades would lose for the same underlying reason | Treat related positions as one risk group |
A warning signal should trigger a defined action, not a debate during market stress.
Position size should come from a repeatable formula rather than confidence in a particular setup:
Position size = money at risk ÷ (stop distance × value per point)
For example, a trader risking 0.5% of a $10,000 account has an illustrative risk budget of $50.
If the stop distance and point value imply a larger loss, the position must be reduced before the order is placed.
Set Drawdown and Recovery Rules
Drawdown rules should state when testing pauses and what evidence allows trading to resume.
A 10% loss requires an 11.1% gain to recover, while a 20% loss requires a 25% gain.
Larger losses place greater pressure on future decisions.
A practical recovery process can use three stages:
- Pause: Stop the strategy when its maximum drawdown is reached.
- Review: Check execution, market conditions, rule changes, and losing-trade clusters.
- Resume carefully: Restart only after a defined sample of trades supports the original assumptions, possibly at half the normal risk.
Building risk frameworks this way makes testing more honest.
The strategy must prove not only that it can make money, but also that its losses remain controlled when conditions become difficult.
Measure Strategy Risk With Evidence
A strategy can look exceptional in a backtest and still be unsafe to trade.
Imagine a system that turns ₦1 million into ₦1.8 million over five years, yet suffers one 42% drawdown caused by a rare sequence of losses.
The final return looks attractive, but the trading plan may demand more capital and emotional discipline than most traders can sustain.
That danger often hides inside smooth equity curves, selective historical periods, or too few trades.
Sound risk assessment in trading therefore examines how returns were produced, not just where the account finished.
Track the metrics that reveal how a strategy behaves
Review each measure alongside the others.
No single statistic can describe execution risk, market dependence, or the pressure created by losing trades.
| Metric | What it shows | Why it matters | Warning sign |
|---|---|---|---|
| Maximum drawdown | The largest peak-to-trough account decline | Shows historical capital stress and recovery needs | A decline large enough to cause forced closure or emotional exit |
| Loss frequency | How often trades close below their entry result | Helps set realistic expectations during normal losing periods | Losses occur far more often than the strategy rules imply |
| Average win-to-average loss ratio | The typical winning trade compared with the typical losing trade | Shows how much accuracy the system needs to remain viable | Large average losses require unusually frequent wins |
| Profit factor | Gross profits divided by gross losses | Indicates whether total winning value outweighed total losing value | A ratio barely above 1.0, especially after costs |
| Sharpe ratio | Return relative to the variability of those returns | Helps compare risk-adjusted performance across strategies | A strong figure based on short data or unstable returns |
| Expectancy | Average amount gained or lost per trade over a sample | Connects win rate, payoff size, and trade frequency | Positive expectancy depends on one unusually large result |
| Recovery time | How long the account took to regain a previous high | Reveals how long capital may remain below its old peak | Recovery takes years or never occurs within the test |
| Consecutive losses | The longest losing sequence in the sample | Prepares the trader for psychological and funding pressure | The observed streak is too short to support live assumptions |
Profit factor can hide a long losing spell, while Sharpe ratio may mislead when returns are not evenly distributed.
Expectancy also changes when spreads, commissions, slippage, financing costs, and execution delays enter the calculation.
A stronger trading strategy risk management process compares the backtest with unseen evidence.
Run a forward test on live market data without changing the rules, then compare its trade frequency, drawdown pattern, average outcomes, and execution costs with the historical results.
After that, examine live performance separately.
A strategy may keep its win rate but lose its edge through wider spreads, missed entries, rejected orders, or different market conditions.
Record results in three distinct groups: backtest, forward test, and live trading.
The sample needs enough trades to support the conclusion.
Twenty trades can reveal that a rule is operationally difficult, but they rarely establish dependable long-term performance.
A useful review checks whether results remain similar after removing the best trade, splitting the data into different market periods, and testing unseen dates.
When the evidence is thin, describe the strategy as unproven rather than profitable.
That discipline is central to building risk frameworks that can survive uncertainty instead of merely documenting past success.
Stress-Test the Framework Against Real Market Pressure
A strategy can appear safe until one extreme event changes every assumption at once. Calm markets often hide the effects of wider spreads, delayed execution, price gaps, and rising correlations.
That is why sound risk assessment in trading must include conditions that may not appear in ordinary backtests.
A system that survives routine losses may still fail when volatility jumps, liquidity disappears, or several positions move against you together.
Scenario testing turns those weaknesses into measurable questions.
Instead of asking whether a strategy usually works, ask how it behaves when execution becomes difficult and market relationships change.
Build scenarios around actual failure points
Use at least three conditions: mild, adverse, and extreme.
The figures should come from your own position sizes, stop distances, account currency, and broker terms.
| Scenario | Volatility and price action | Expected loss | Exposure and liquidity | Required action |
|---|---|---|---|---|
| Mild | Normal spread widening and faster price movement | Planned loss remains within the trading limit | Orders fill with minor slippage | Continue, while recording execution quality |
| Adverse | Larger spread, partial slippage, and a gap near the stop | Loss exceeds the planned amount | Exposure becomes harder to reduce | Cut new trades and reassess open risk |
| Extreme | Sharp gap, rejected order, or temporary market access failure | Multiple positions may lose simultaneously | Exit liquidity becomes uncertain | Halt trading and follow the emergency plan |
Include order placement, stop execution, margin requirements, broker communication, and the time needed to close positions.
Add Nigerian market and currency pressure
For Nigerian traders, the account balance may be measured in naira while the position is priced in dollars or another foreign currency.
A weaker naira can therefore change the local-currency value of both gains and losses, even when the quoted market price moves modestly.
Market access deserves its own test.
Consider wider spreads during important releases, restrictions on funding or withdrawals, broker downtime, and delays caused by payment channels.
These risks do not fit neatly into a price chart, yet they can determine whether a trader exits on time.
Stress correlation, not just individual trades
Five positions are not automatically five separate risks.
Currency pairs may share the same dollar exposure, while commodities and related equities can respond to one economic shock.
Group trades by common drivers, then test a period where those drivers move together.
A useful rule is to increase assumed correlation sharply during the adverse and extreme cases.
If the combined loss becomes unacceptable, reduce overlapping exposure before adding another position.
This is the practical side of trading strategy risk management and building risk frameworks: test the conditions that make normal assumptions fail.
A framework earns trust only after it has faced pressure from price, liquidity, currency, access, and correlation at the same time.
Turn the Assessment Into a Working Risk Framework
The best risk framework is rarely the most complicated one. A trader needs a process that can be followed during a busy session, not a spreadsheet filled with measures that nobody reviews.
Practical risk assessment in trading connects each decision to evidence.
At entry, record the setup and planned exposure.
During the week, check whether execution matches the plan.
At month-end, decide whether the strategy should continue, change, or stop.
A repeatable review cycle
| Review stage | Questions to ask | Evidence required | Decision |
|---|---|---|---|
| Before testing | What market, timeframe, setup, and trading costs will the strategy use? | Written rules, market data range, spread and fee assumptions | Approve testing or rewrite unclear rules |
| During backtesting | Does the strategy follow one consistent rule set across different market periods? | Trade log, sample size, entry and exit records | Continue testing or reject inconsistent results |
| During forward testing | Does live execution resemble the tested model? | Timestamped trades, slippage records, missed signals | Proceed, adjust execution rules, or pause |
| Before live trading | Is the strategy understood well enough to define normal and abnormal outcomes? | Approved plan, position-size formula, broker conditions | Approve limited live exposure or delay launch |
| Weekly monitoring | Are entries, exits, costs, and rule breaks changing? | Weekly journal, execution review, error count | Continue or correct process problems |
| Monthly review | Has the strategy behaved within its documented operating range? | Equity curve, drawdown record, return and trade-quality review | Continue, adjust one variable, or place under review |
| Drawdown breach | Did losses come from market conditions, execution, or a broken assumption? | Trade-by-trade investigation and rule comparison | Pause trading until a written decision is recorded |
A losing trade can still follow the plan, while a profitable trade can hide poor discipline.
For traders building risk frameworks, the review record matters as much as the trading result.
It creates an audit trail and prevents one emotional week from deciding a strategy’s future.
Create a practical assessment template
Use one page for every strategy.
Keep the fields consistent:
- Strategy identity: Market, timeframe, setup, direction, and intended holding period.
- Trade record: Entry reason, stop location, target, position size, spread, fees, and slippage.
- Risk condition: Current drawdown, recent rule breaks, execution errors, and market regime.
- Decision status: Continue, adjust, or retire, with one written reason and a review date.
Daily discipline becomes easier when rules describe actions, not intentions.
| Do | Don’t |
|---|---|
| Record the trade before entering | Edit the journal after seeing the result |
| Reduce size after a documented breach | Increase size to recover losses |
| Review one variable at a time | Change entry, exit, and sizing together |
| Pause when evidence is incomplete | Treat a short winning streak as proof |
Applying the framework to a volatile market
Consider a hypothetical USD/NGN or equity-index strategy that risks ₦10,000 per trade.
If the planned stop distance is 250 points and each point is worth ₦40, the position size is:
Position size = ₦10,000 ÷ (250 × ₦40) = 1 unit
The trader then records the result after each trade, reviews execution weekly, and compares monthly performance with the original rules.
A strategy continues when its rules and execution remain intact.
It needs adjustment when one specific assumption changes.
It should be retired when repeated evidence shows that its edge no longer survives real trading conditions.
A simple framework earns trust through consistent use.
The strongest process is one that turns every trade into better evidence for the next decision.
Is Nigeria a rich or poor country in the world?
The trading-focused article does not state whether Nigeria is considered rich or poor. It focuses on building a risk assessment framework for trading strategies, including how to measure risks like naira moves, spread widening, and execution failures. For an accurate classification, you would need a separate, up-to-date economic source such as GDP per capita or World Bank income classifications.
How much is $100 US in Nigeria?
The article does not provide an exchange rate or calculate how much $100 USD equals in Nigeria’s naira. It discusses trading risks involving naira moves and account currency conversion, but it does not include specific currency conversion figures. To answer this precisely, use the current USD to NGN rate from a reliable forex source or bank.
Is Nigeria friendly to tourists?
The article does not address whether Nigeria is friendly to tourists. Its content is about risk assessment for trading strategies, highlighting factors like volatility spikes, liquidity changes, slippage, and execution delays rather than travel conditions. For a practical answer, consult current travel advisories and tourism resources from official agencies and recent guides.
What are the 4 laws in Nigeria?
The article does not list “4 laws in Nigeria,” so there is no named set of four laws available from its content. Nigeria’s legal system is broad and includes constitutional provisions, statutes passed by the National Assembly, and regulations issued by authorities, among other sources. A correct list depends on what “4 laws” refers to (e.g., major acts, constitutional principles, or specific legal categories).
Make Risk Rules Stronger Than Your Conviction
A profitable strategy is not necessarily a safe one.
The most valuable habit in trading is to define how much you can lose, under which conditions, and how the plan changes before a sudden naira move, widening spread, or overnight crypto sell-off forces the decision for you.
Sound risk assessment in trading turns uncertainty into boundaries you can follow.
The example of a strategy surviving normal market conditions but failing under sharp price gaps shows why historical returns are only part of the evidence.
Position size, stop placement, maximum drawdown, liquidity, and correlated exposure must work together; otherwise, trading strategy risk management becomes a collection of good intentions rather than a working control system.
Stress tests and equity-curve reviews reveal weaknesses that a profitable backtest can hide.
Today, write down three limits for your current strategy: the maximum loss per trade, the largest acceptable account drawdown, and the point at which you pause trading for a review.
Then test those limits against a sudden currency move and a spread wider than usual. Treat the results as operating rules, not suggestions. That discipline is the foundation of building risk frameworks that can withstand real pressure without forcing you into emotional decisions.