

A strategy can look brilliant on paper and still fail the moment real money is on the line.
That gap usually comes from trading strategy mistakes, not from bad luck.
The trap is deciding too early—judging a system by the wrong numbers, the wrong time frame, or a sample that’s far too small.
Those evaluation errors make weak methods look safe, and solid methods look unreliable.
Good trading strategy analysis is less about finding a perfect setup and more about spotting where a method breaks under pressure—when conditions shift, when results get noisy, and when the track record isn’t large enough to trust.
A sharp win rate can tempt you into quick conclusions, but a strategy earns credibility only when the process holds up across more trades and more market moods.
That is why we’re focusing on the most common ways traders get misled before strategy adoption: short-term streaks, thin data, hidden market-regime effects, and fragile testing assumptions.
Quick Answer: A trading strategy should be judged on repeatable performance over many trades and market conditions—not on short winning streaks or a handful of recent results, because 10 trades are often too small to reveal a true edge. Prioritize risk-first evaluation by checking that entries, position sizing, and stop discipline remain valid across different volatility/regimes, since a profitable backtest can still hide trading strategy mistakes.
Are We Judging the Strategy or Just the Last Few Trades?
A string of green trades can feel convincing fast.
That is exactly where a lot of traders slip into evaluation errors and start praising a weak system for the wrong reasons.
A strategy should be judged over many trades, not by a short cluster of outcomes.
Short runs can look clean even when the underlying process has no real edge—because timing, market noise, or a favorable micro-regime temporarily boosts results.
- Short runs distort judgment: A handful of wins can be the result of chance distribution, temporary volatility conditions, or simply a market period that favored the ruleset.
- Luck can mimic skill: A lucky streak often looks smooth and controlled. The danger is that it rewards the trader just enough to hide trading strategy mistakes like poor entries, oversized risk, or stop-rule failures.
- A profitable week can still be flawed: Imagine a trader who wins 7 out of 8 trades by chasing momentum after news spikes. The week ends green, but the method has no repeatable edge—and the losses usually show up once that impulse-driven behavior fades.
- Good systems can feel unimpressive at first: A real strategy follows rules, not moods. In uneven markets, that steadiness is useful—because it doesn’t change just because the last few trades looked great.
Instead of asking, “Did it work this week?”, ask, “Would the same rules still look credible when I’m not anchored to the most recent trades?”
If the conclusion changes every time you zoom out, the issue is usually the review process—not the market.
That is why we keep coming back to process, not streaks.
The last few trades can be noisy, but the full record—and especially how the rules behave when conditions change—tells the truth.
The Biggest Evaluation Error: Focusing on Profit Before Risk
A strategy can look impressive and still be fragile.
That is the trap behind many trading strategy mistakes.
Traders see net profit first, feel relieved, and only later notice the equity curve was hanging by a thread.
Profit matters, but profit alone is a poor judge of quality.
A system that earns steadily with shallow setbacks tells a very different story from one that makes the same money after punishing drawdowns.
Consider a trader who doubles a small account in a few months, then gives back half of it during the next losing spell.
The headline result looks strong.
The trading strategy analysis changes fast once risk enters the picture.
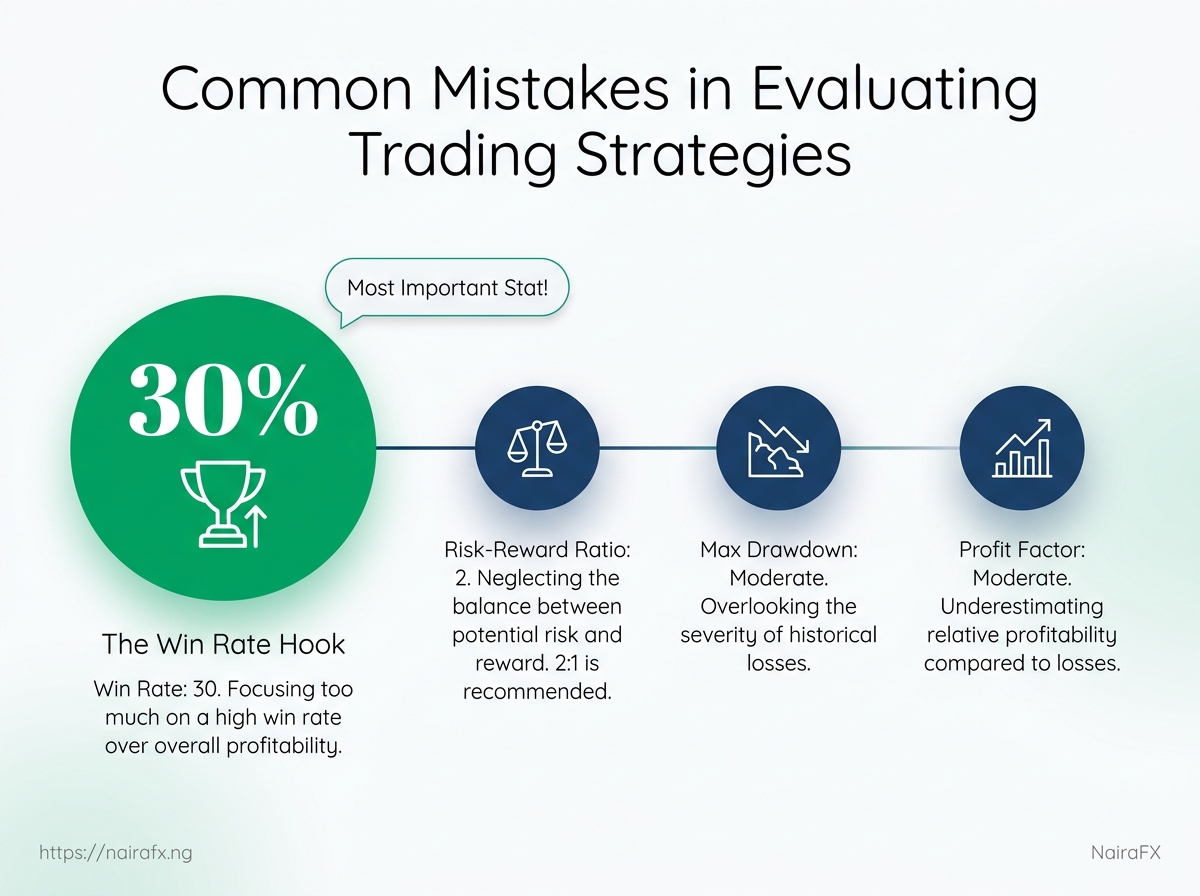
Checklist: the risk metrics we should check before judging results
| Metric | What It Tells Us | Common Mistake | Better Review Question |
|---|---|---|---|
| Win rate | How often the strategy is right | Assuming a high win rate means a strong strategy | Does the average loss stay controlled? |
| Risk-reward ratio | How much we risk versus what we aim to gain | Ignoring weak payoff structure | Does one win cover several losses? |
| Maximum drawdown | Largest drop from peak performance | Not preparing for deep losing periods | Can we survive this drawdown emotionally and financially? |
| Profit factor | How much profit is made per unit of loss | Looking at net profit only | Is the gain worth the level of risk taken? |
That is why evaluation errors often start with the wrong question.
The better habit is simple: judge the risk first, then the profit.
When those four metrics sit together, the picture becomes much clearer, and weak systems lose their shine quickly.
A clean profit curve is nice.
A profitable curve that stays intact during hard stretches is far more valuable.
The difference shows up in decision-making too.
Traders who skip drawdown checks often over-size too early, then panic when the market does what markets always do.
A Common Trap: Testing a Strategy on Too Little Data
A strategy can look impressive after five or ten trades, but that number is far too small to trust.
That is where many trading strategy mistakes begin.
The results feel real because they are recent, vivid, and easy to remember.
In trading strategy analysis, that kind of comfort can turn into evaluation errors very quickly.
One rainy day does not prove a weather forecast.
Markets work the same way.
A short streak can come from luck, a temporary trend, or one unusual session that says little about future behavior.
A small sample also hides the ugly parts.
It may miss slippage, quiet periods, sideways markets, or the exact conditions that usually break the setup.
A strategy that looks smooth on a tiny sample often gets rough fast once real variety shows up.
For a basic review, most traders should want at least 30 trades in the same setup before drawing serious conclusions.
Better still, 50 or more trades gives a clearer picture of how the method behaves across different days and market moods.
That does not mean the strategy is proven.
It means the sample is finally large enough to inspect it with less guesswork.
- Enough trades should come from different sessions, not one lucky week.
- They should include both strong and weak markets, because a strategy that only works in one condition is fragile.
- They should be from the same ruleset, because mixing setup types ruins the read on performance.
A useful habit is to ask whether the result would still matter if you removed the best three trades.
If the answer changes completely, the sample is still too thin.
There is a quiet kind of discipline in waiting for more data.
It feels slower, but it saves traders from falling in love with noise.
Enough history does not guarantee a good system.
It just gives you a fair chance to see the truth.
Why Ignoring Market Conditions Breaks Strategy Analysis
A strategy does not fail in a vacuum.
It usually fails because the market changed, and the rules never did.
That is why the same setup can look polished in one phase and messy in another.
A breakout method can thrive when price is moving cleanly, then look broken the moment price starts drifting sideways.
In trading strategy analysis, ignoring the backdrop turns a market-regime problem into an evaluation error.
Volatility, spreads, and timing all bend the results in quiet but powerful ways.
A pair with wide spreads can make a decent setup look weak, especially when the target is small.
The same goes for session timing: a signal that works during a liquid London open can behave very differently in a thin Asian session.
> A five-pip spread on a 15-pip target changes the math far more than most traders expect.
Consider a simple moving-average crossover on GBP/USD.
During a strong trending phase, it can catch clean direction and hold for meaningful moves.
Move that same setup into a range-bound month, and the crossover keeps flipping direction, which creates a string of trading strategy mistakes that have little to do with the logic itself.
That is the real trap.
Traders often blame the method when the market regime is the real culprit.
A better review starts with context, then performance.
- Match the regime: Test the strategy in trend, range, and high-volatility conditions, not just one favorite market.
- Check transaction cost pressure: Compare spread, slippage, and target size before trusting the result.
- Separate session behavior: A setup can work in London and fail in New York close or low-liquidity hours.
- Watch timing sensitivity: News windows, rollover, and market opens can distort entries and exits fast.
Our trading strategy analysis pays close attention to those shifts because a clean equity curve in one environment can hide weak structure in another.
That discipline saves time, money, and plenty of false confidence.
When market conditions are part of the review, the strategy gets judged for what it really is.
Is the Backtest Wrong, or Are We Backtesting the Wrong Way?
A backtest can look polished and still tell a false story.
That usually happens when the rules were shaped around the past instead of tested against it.
More data does not fix that.
A larger sample only gives a flawed idea more room to spread, which is one of the most expensive trading strategy mistakes in practice.
The harder part is that many evaluation errors feel sensible at first.
Traders trust a rising equity curve, then miss the weak logic underneath it.
Backtest mistakes and the cleaner way to test
| Mistake | Why It Misleads | Better Practice | Impact on Analysis |
|---|---|---|---|
| Curve fitting | Rules are tuned too closely to past data and stop being general | Keep rules simple and test on unseen data | Creates unrealistic confidence |
| Ignoring costs | Spreads and commissions are left out | Include all trading costs | Gives inflated performance results |
| Using only one market phase | Results may not hold in different conditions | Test across trending, ranging, and volatile periods | Improves realism |
| Overlooking slippage | Entries and exits may be worse than expected | Model slippage in the test | Makes the review more practical |
| Not separating in-sample and out-of-sample periods | The model is judged on the same data it learned from | Hold back fresh data for validation | Reveals hidden weakness |
| Ignoring execution delay | Signals look cleaner than live fills | Add realistic latency assumptions | Narrows the gap between test and live trading |
| Testing one instrument only | A strategy may depend on one pair’s behavior | Check related markets and pairs | Shows whether the edge is narrow or durable |
| Skipping parameter sensitivity checks | A tiny rule change can break the system | Test small shifts in inputs and thresholds | Exposes fragile logic |
That is why clean trading strategy analysis focuses on execution, costs, and rule stability before it trusts the result.
A simple check helps here: if a strategy only works when every assumption is generous, it is not ready.
The goal is not to make the curve look better; it is to see whether the edge survives real-world friction.
That kind of review catches the errors that matter most.
It also keeps traders from mistaking a well-fitted story for a tradable system.
What Happens When We Ignore Discipline and Risk Rules?
A trader takes three losses, rewrites the plan, and calls it “adjustment.” By next week, the stop size is wider, the entry filter is softer, and the position size is different again.
That is where trading strategy mistakes turn into chaos.
Once rules change after every losing streak, the strategy no longer has a stable identity, so evaluation turns into guesswork.
Emotional reactions are usually the first problem.
Fear pushes traders to cut risk too fast, while frustration pushes them to chase payback with looser rules and bigger trades.
A simple way to stay honest is to review the same plan against the same standards every time.
If the setup, risk, and exit rules keep changing, the result is not strategy analysis anymore.
- Freeze the rules: Keep entries, exits, and risk limits fixed for a full review window. Changing them mid-test makes it impossible to know what actually worked.
- Log the reason for each trade: Write down whether the trade fit the plan, not just whether it won. A trade journal catches emotional drift before it becomes a habit.
- Separate loss from error: A valid setup can still lose money. A bad decision is different, and mixing the two leads to false conclusions.
- Check rule adherence: Measure how often the plan was followed exactly. A strategy with weak discipline often looks worse than it really is.
- Review by market condition: Compare the same setup in trending and choppy periods. That shows whether the issue is the method or the mood of the market.
- Track risk per trade: If size changes after losses, the equity curve becomes harder to read. Stable risk makes the real pattern visible.
A trader who keeps changing rules after every setback usually learns the wrong lesson.
The plan did not fail because it lost once; it failed because emotions were allowed to edit the test.
Good trading strategy analysis depends on discipline that survives a bad week.
Without that, every result feels personal, and every conclusion gets shaky.
What is the 3-5-7 rule in trading?
The 3-5-7 rule is a risk-control guideline that caps how much you allow yourself to lose over different time horizons. A common version limits losses to about 3% per trade, 5% per day, and 7% per week. It supports discipline, which matters because profit-only evaluation can hide fragile strategies that fall apart during drawdowns.
What is a good Sortino ratio?
A good Sortino ratio is typically one that’s clearly above 1.0, meaning your returns compensate for downside volatility rather than overall volatility. While exact targets vary by market and strategy, the key is that your risk-adjusted metrics must stay consistent across many trades and changing market conditions, not just a short winning stretch.
Is a 0.7 Sharpe ratio good?
A 0.7 Sharpe ratio is generally not considered strong because it suggests returns are only modestly compensating for total volatility. It can be closer to “average” depending on the strategy and market, but it’s rarely the kind of signal you’d trust on its own. The more important check is whether the results are repeatable over enough trades and market regimes, not distorted by a small sample.
What is the 5 3 1 rule in trading?
The 5-3-1 rule is a common risk/discipline heuristic used to limit losses and keep position sizing under control across time or exposure levels. In practice, traders often apply it as a tiered loss cap (for example, larger limits at the broadest level and smaller limits at the most immediate level). The purpose is the same: prevent evaluation errors where profit looks good while risk rules are actually being violated.
What is the difference between backtesting and walk forward testing?
Backtesting evaluates a strategy on historical data in one pass, which can encourage curve fitting if the rules are tuned to the past. Walk-forward testing repeatedly trains on an earlier window and tests on a subsequent out-of-sample period, which better checks whether performance holds up as conditions change. That out-of-sample discipline helps avoid the false confidence that comes from a rising equity curve on the wrong data.
Judge the Process, Not the Payout
The best-looking strategy on paper often stumbles because the evaluation started with profit and ended with risk.
That is where most trading strategy mistakes begin, especially when a backtest is based on too little data or ignores a market that later turns choppy.
The real test is not whether a system caught one strong trend.
It is whether it still holds up when conditions change, spreads widen, and discipline slips for a few trades.
That is why evaluation errors matter so much: they hide weak logic behind a lucky run.
Review one strategy on its worst month today. Check drawdown, sample size, and whether the rules still make sense outside the market phase that helped it win.
If you want a sharper read, our trading strategy analysis focuses on exactly that kind of stress test.
1 thought on “Common Mistakes in Evaluating Trading Strategies”