

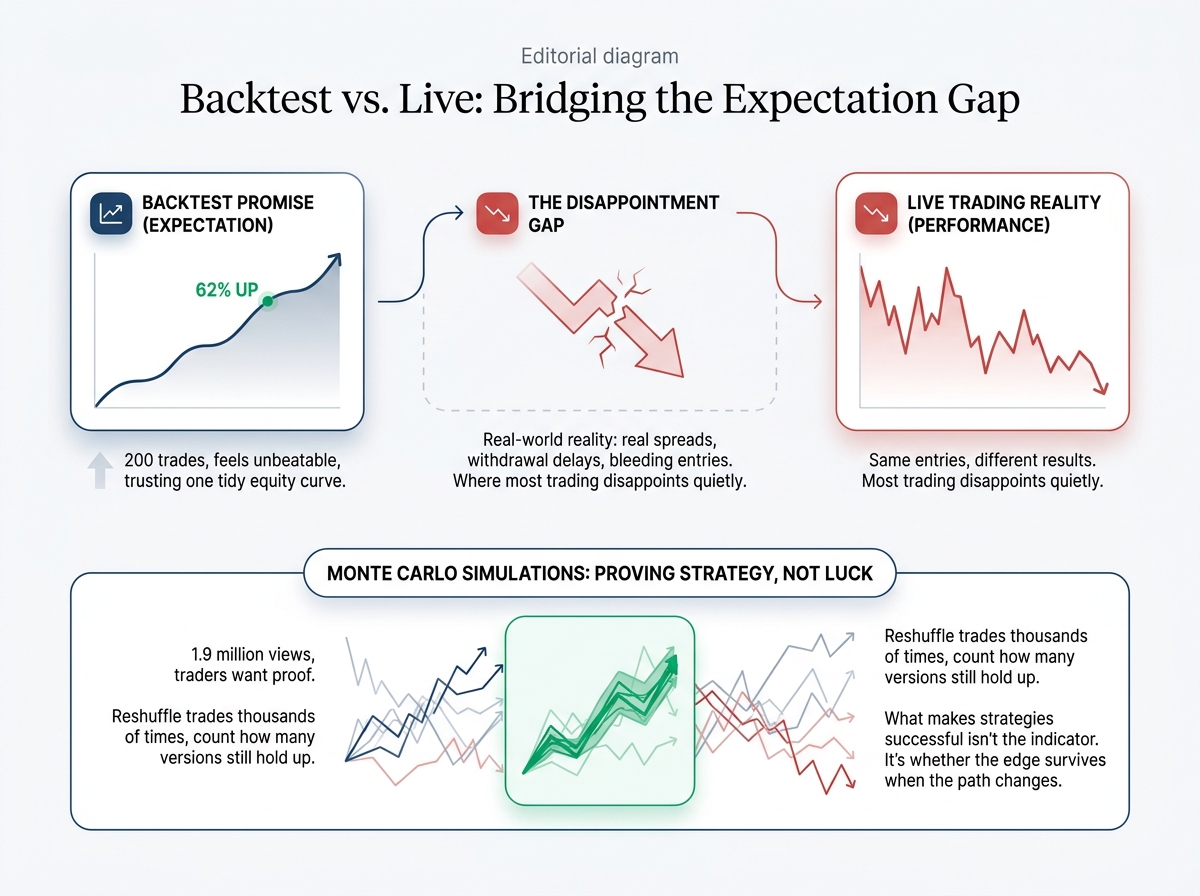
A demo strategy makes 200 trades, earns a 62% profit, and seems unbeatable.
Then you trade live with real naira, real spreads, and withdrawal delays. Suddenly, those same trades start losing.
This gap between backtesting and live trading can often leave us disappointed.
Funded Trading Plus reports that a video on Monte Carlo backtesting reached 1.9 million views by late 2025. Traders want proof that their results weren’t just luck.
Monte Carlo simulations are how you get that proof.
Instead of relying on one clear equity curve, you shuffle the trades thousands of times to see how many still perform well.
The case studies ahead are hypothetical — three strategies built around decisions Nigerian traders genuinely face.
Broker costs are quoted in USD/NGN, and execution issues in Lagos, Abuja, or Port Harcourt show how traders react when the naira fluctuates.
The success of those strategies isn’t due to the indicator.
It’s about whether the advantage remains when conditions change.
Quick Answer: Monte Carlo simulations provide a method for evaluating trading strategies by reshuffling trade sequences thousands of times to assess their resilience against market conditions like slippage and changing costs. This approach helps to identify whether the initial backtest results, such as a 62% gain, can withstand the unpredictability of live trading environments. Ultimately, it highlights the critical difference between theoretical success and real-world trading performance.
Three Trading Strategies, One Safer Evaluation Question
Imagine a trader in Lagos who just finished backtesting their strategy. The results show a promising equity curve. The initial results look good enough for them to start live trading. However, this change often leads to unexpected outcomes.
Even if our models show profitable backtests, we need to check if those results can withstand real-world challenges like market slippage and changing costs. This section presents three hypothetical trading strategies for evaluation, highlighting how important it is to be resilient when moving from theory to practice.
Case Study One: A Smooth Trend-Following Strategy Meets Randomized Trade Order
While trend-following strategies might look perfect in backtests, they can falter when we put real money on the line.
A swing trader in Lagos builds a trend-following system for GBP/USD and USD/NGN. They record 200 trades and find a win rate of about 45%, with an average reward-to-risk ratio of 1.8:1.
Profit factor lands near 1.6 — comfortably above the 1.5 floor we treat as a minimum.
On paper, the equity curve rises steadily.
The trade list remains the same.
Only the order changes: those same 200 trades are shuffled into 1,000 random sequences. Each sequence is then checked for drawdown depth and recovery time.
If the apparent smoothness is mainly “earned” by the timing of winners and losers, then randomizing order should make the outcomes spread out—some runs would recover faster, others would linger at lower equity for longer.
That is the core idea behind Monte Carlo simulation basics for backtesting.
Case Study Two: The Breakout Strategy That Needed Cost and Slippage Stress
A breakout strategy is a good second example because its advantage is close to the spread.
A trader in Port Harcourt develops a simple breakout system on a 15-minute chart. They enter a trade when the price closes above a 20-period range, set a stop 50 pips away, and target 100 pips.
The backtest wins frequently, and the equity curve appears convincing.
However, every win assumed that entry happened at the breakout price, with a normal spread and no delays.
However, reality is different.
Spreads widen when liquidity is low. Fills may arrive late during fast price movements. Commissions reduce profits on every trade, and overnight swaps quietly charge for any position held past rollover.
So we rerun the same trades through Monte Carlo simulations under three cost environments instead of one.
Each assumption below comes from account records or a broker’s published specification, stated plainly so the comparison stays honest.
Three Execution Environments for the Same Trade Sequence
| Testing environment | Spread assumption | Slippage assumption | Commission and swap treatment | Expected effect | Pass or review status |
|---|---|---|---|---|---|
| Baseline execution | 1.0 pip average on the breakout pair | 0 pips on entries and exits | Commission included; swap ignored on trades closed the same session |
Case Study Three: A Signal-Led Strategy That Failed the Risk-Rule Test
A win rate of 68% can still lead to losses.
Recent research shows that a trader in Abuja pays around ₦48,000 a month for a signal service and follows every alert using a $500 account.
After over 90 trades, the win rate is about 68%, and the headline return appears strong.
However, the trade log hides the issue of trade sizing.
Some alerts are traded with 0.05 lots, while others use 0.20. The amount depends on the trader’s confidence each day.
Moreover, risk is concentrated in three correlated USD pairs. This means a single dollar move affects all open positions simultaneously.
For the intervention, we rebuild the trade list with fixed risk at 1% per trade, using the sizing and cost assumptions in our backtesting guide, then run Monte Carlo simulations across 1,000 shuffled sequences.
Three stress rules get layered in: skipped trades from missed alerts or network delays, a 12-trade losing streak, and the monthly subscription cost deducted from equity.
The reshuffled equity curves spread far wider than the original backtest suggested.
Drawdowns become the key signal, not the average win rate, and the risk-rule test fails under realistic disruptions.
How to Read the Results Without Calling Every Profitable Strategy Safe
Imagine this: You look over a Monte Carlo report for a Nigerian account.
What should you focus on first? Many traders start with the average ending balance and feel safe—but you should really look at the worst-case drawdown from the simulations. This number is more important than the average.
Build Alpha frames the technique’s purpose plainly: it exists to expose lucky backtests and misleading performance metrics.
TradeZella’s free simulator runs between 1,000 and 10,000 simulations to achieve this.
A strategy that survives thousands of reshuffled sequences without exceeding your risk limit deserves a closer look.
One that only looks profitable in its original sequence has not.
Before transferring any simulation finding into a live Nigerian account, run checks:
- Drawdown tolerance in naira: convert the worst simulated drawdown to naira at your true account size.
- Cost realism: rebuild the test with the wider spreads, swaps, and commissions you actually pay.
- Execution assumptions: confirm your broker fills near the prices the test assumes.
- Data quality: thin sessions and messy ticks distort results more than most traders expect.
- Sample size: fewer than 30 trades rarely produces a meaningful distribution.
Following the Monte Carlo simulation basics for backtesting workflow keeps these checks in one place.
Monte Carlo output is evidence about fragility, not a forecast of profit—read the distribution, not the headline result.
Building a Reproducible Monte Carlo Review
What makes a Monte Carlo review repeatable next quarter different from one you’ll never replicate? The answer sits before the simulation starts, not after it finishes.
A trader in Ikeja runs 2,000 Monte Carlo simulations on the Abuja signal strategy, gets a tidy median curve, then cannot say which trade log produced it.
That gap in traceability turns the “result” into something no one can verify—or rerun.
Unrepeatable work protects nobody.
Start with a clean trade log, not a polished equity curve.
Each closed trade must have a timestamp, entry and exit price, spread, commission, and swap captured at execution.
Without those execution details, you don’t just lose clarity; you lose the ability to rebuild the exact inputs that generated the distribution.
Then keep the review template disciplined and minimal, so the next run uses the same assumptions and data.
A journal such as TradeZella’s simulator will happily run 1,000+ equity curve paths, but it can only be as honest as the data you feed it.
Can ChatGPT run a Monte Carlo simulation?
ChatGPT cannot run Monte Carlo simulations directly, as it is primarily a text-based AI model. However, it can provide guidance on how to implement such simulations and discuss their methodologies.
Who is the best forex trader in the world in 2026?
There are no definitive rankings for the best forex trader in 2026, as trading success fluctuates based on market conditions and individual strategies. Success in trading is often subjective and varies by different metrics such as profitability, consistency, and risk management.
What is a good percentage for Monte Carlo simulation?
A good percentage for success in a Monte Carlo simulation varies by strategy, but generally, traders look for a win rate and risk-reward ratios that exceed their loss percentages. It is more essential to focus on the range of outcomes rather than a single percentage.
Can ChatGPT backtest a trading strategy?
ChatGPT cannot backtest trading strategies directly, as it lacks the capability to execute trades or analyze real-time data. However, it can explain backtesting concepts, provide insights into best practices, and suggest tools to perform backtesting effectively.
What are the limitations of Monte Carlo simulation?
Monte Carlo simulations have limitations, including their reliance on the accuracy of the input data and assumptions. They may also not account for extreme market conditions or rare events, leading to potentially misleading results if not interpreted cautiously.
What the Naira Actually Remembers
Industry data shows that the 62% demo gain mentioned at the start rarely persists with real spreads., and that is the lesson worth carrying forward.
In all three hypothetical case studies, the strategy that looked strongest on paper wasn’t necessarily the one that stood up best under randomized trade order, cost stress, and slippage.
The signal-led strategy that passed the risk-rule test failed, while the trend-following one barely flinched — because its edge lived in the rules, not the equity curve.
Monte Carlo simulations do not forecast your future.
They show you the range of futures your strategy might already contain, including the ugly ones your backtest conveniently skipped.
Run yours before your next deposit, not after your first drawdown.
Start by re-running one strategy you trust with randomized trade sequencing and realistic USD/NGN spreads. If it survives that, you have something worth trading.
If it doesn’t, you’ve saved yourself the tuition.
Our backtesting and risk framework guidance is here when you want a second set of eyes.