

A trader can be right about direction and still end the week in red—because survival isn’t decided by forecasts. It’s decided by risk.
In the case studies below, Nigerian traders tighten the few controls that consistently determine outcomes in live Forex: position size, stop-loss placement, the amount of risk per trade, and the rules they follow when a streak turns ugly.
You’ll see what changed before vs. after, how the equity curve responded (drawdown, recovery, and behavior shifts), and the specific risk habits that kept them trading long enough for their strategy to matter.
Quick Answer: Successful Forex risk management is what prevents a correct direction from turning into account-level losses by capping how much you can lose per trade and sizing positions accordingly. In the Nigerian trader example, the trader tightened risk to a 2% cap per trade, so even during losing streaks they avoided oversizing and could keep trading long enough for the strategy to work. Control position size, stop-loss placement, account risk per trade, and trade selection together to survive normal drawdowns without panic or revenge trading.
What does successful risk management actually look like in real trades?
Why do so many traders get the entry right and still lose money? Because the entry is only one piece of the trade, while risk control decides whether one bad idea turns into a small bruise or a blown account.
Successful trading examples usually look boring on the surface.
The trader knows the maximum loss before the order goes live, keeps size small enough to survive a string of losses, and avoids forcing trades in weak conditions.
In a live Forex account, risk management means controlling four moving parts at once: position size, stop-loss placement, account risk per trade, and trade selection.
When those pieces work together, the account can absorb normal drawdowns without panic or revenge trading.
A practical example makes this easier to see.
Imagine a trader with a $1,000 account risking 1% per trade, or $10.
A clean setup appears, but the stop is wide, so the lot size must shrink.
That trade may look smaller, yet it is healthier than squeezing in larger size and hoping the market behaves.
That is why Forex risk management case studies teach faster than theory.
A chart on its own tells you where price moved, but a case study shows how the trade was sized, where the exit sat, and why the account survived the loss.
- Position size: Set first, not last. It should match the account’s risk limit, not the trader’s excitement.
- Stop-loss placement: Place it where the trade idea is wrong, not where the loss feels comfortable.
- Trade selection: Skip weak setups. The best risk control sometimes looks like no trade at all.
- Recovery discipline: After a loss, the next trade should still follow the plan, not the mood.
For strategic traders, risk management success stories are rarely about one giant win.
They are about keeping capital intact long enough for an edge to play out over many trades.
That is the part worth copying.
The best traders do not predict every move—they control losses
The traders who last are not the ones who call every turn.
They are the ones who stay small when conditions turn messy, then keep enough capital to trade again tomorrow.
Consider an anonymized intraday trader in Lagos who had a decent win rate but kept raising size after a few good trades.
He cut his risk per trade from 2% to 0.5%, and the account stopped swinging wildly.
The gains became slower, but the drawdowns got shallow enough to survive ordinary losing streaks.
A swing trader faced a different problem.
She was right on direction often enough, but one bad stretch kept pulling her account lower because every losing trade was too large.
Once she fixed her stop-loss rules and capped daily damage, the streak hurt less, and she stayed mentally steady long enough for the next clean setup.
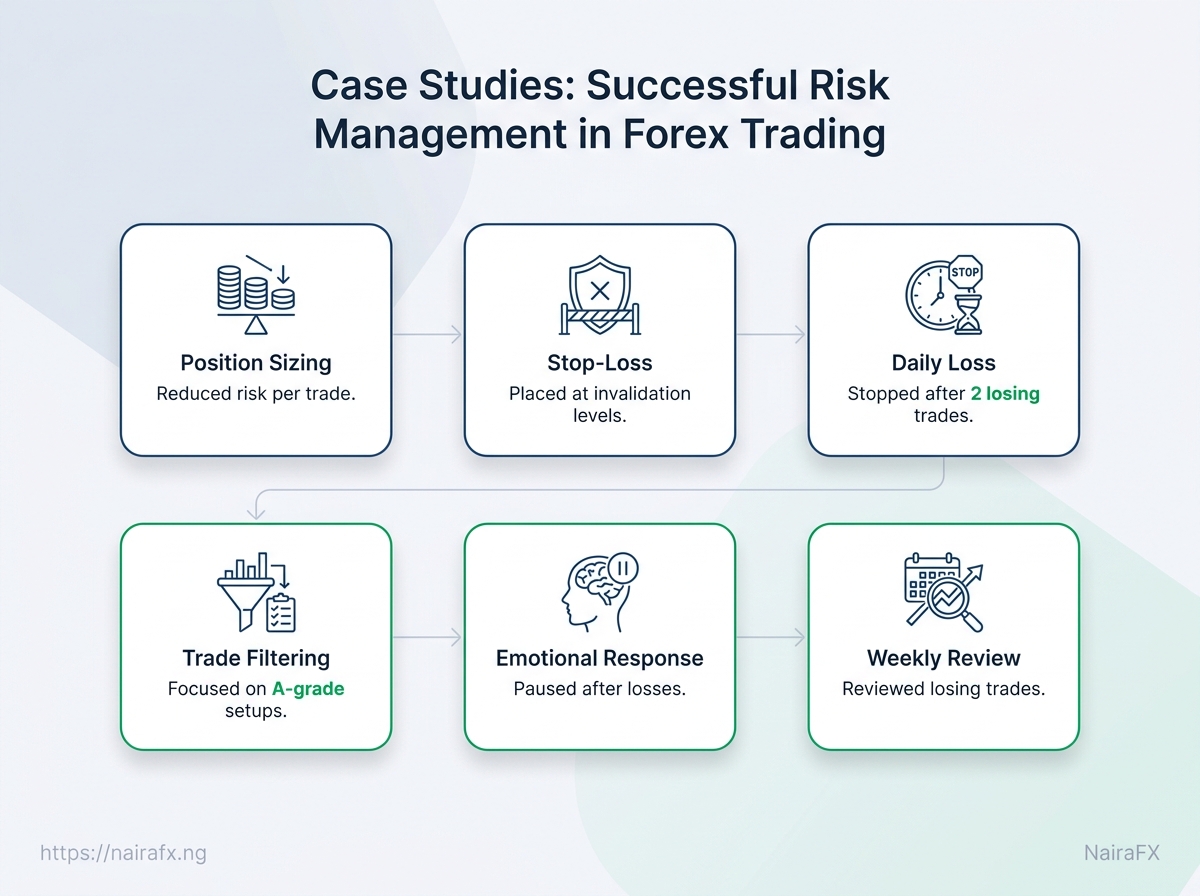
Swing trader discipline before and after the change
| Risk practice | Before change | After change | Effect on account |
|---|---|---|---|
| Position sizing | Risked about 2% per trade | Risked 0.75% per trade | Smaller losses, less volatility |
| Stop-loss placement | Used wide stops based on fear | Placed stops at invalidation levels | Fewer oversized losses |
| Maximum daily loss | No hard stop for the day | Stopped trading after 2 losing trades | Prevented revenge trading |
| Trade filtering | Took setups late in the day | Traded only A-grade setups | Lower trade count, better quality |
| Emotional response after losses | Increased size to recover | Paused after a loss cluster | Protected the next trade |
| Weekly review | Rarely reviewed trades | Reviewed losing trades each Friday | Fewer repeated mistakes |
The account improved not because the trader found a magic entry, but because the loss per mistake became predictable.
That same logic shows up in many Forex risk management case studies.
The best successful trading examples rarely feature perfect prediction; they feature disciplined damage control, steady sizing, and a clear point where trading stops for the day.
- Small risk first: Keep each trade modest enough that a normal losing streak stays survivable.
- Fixed invalidation: Place stops where the setup is wrong, not where the pain feels lowest.
- Daily cutoff: Stop trading after a defined loss limit, even if the next setup looks tempting.
- Review the loss, not just the win: Losing trades reveal whether the rules still make sense.
Those habits do something important.
They turn trading from a guessing game into a repeatable process, which is why so many risk management success stories sound boring on the surface and powerful in practice.
A Nigerian trader’s month after changing one rule
On a Monday morning in Lagos, one trader stopped asking how much he could make and started asking how much he could lose.
The new rule was plain: no single trade could cost more than a fixed slice of the account, even after a rough streak.
That small boundary changed his behavior fast.
He stopped chasing candles after a loss, waited for cleaner setups, and passed on trades that looked exciting but felt sloppy.
The shift became clearer during high-volatility sessions.
When London and New York overlap brought wider spreads and sharper swings, he reduced lot size instead of keeping the same size out of habit.
His trades still had noise.
They always do.
But the account felt easier to manage, because the pressure to win back money in a hurry had dropped.
That is one reason Forex risk management case studies matter: they show that better decisions often start with less emotional damage, not more aggressive trading.
A few changes stood out after that month:
- Stricter loss limit: He capped each trade at a level he could absorb without panic.
- Smaller size in volatile hours: He cut exposure when price action got erratic.
- Less revenge trading: He no longer rushed into the next setup after a loss.
The result was not a dramatic streak of huge wins.
It was something more useful.
His equity curve looked calmer, and his decisions became easier to repeat.
That is the real lesson in successful trading examples and risk management success stories.
Consistency matters more than trying to recover fast, because fast recovery usually comes with rushed entries, oversized positions, and poor judgment.
A trader who protects the next trade keeps the month alive.
A trader who tries to erase the last loss often hands the market another mistake.
For Nigerian traders dealing with volatile sessions and uneven liquidity, that discipline is not a nice extra.
It is the difference between staying in the game and burning out early.
Why a 2% risk cap changes the math fast
A 2% cap looks tiny on paper, but the math turns ruthless fast.
Five losing trades in a row at 2% risk still leave an account with about 90.4% of its starting equity, while the same streak at 5% risk cuts it to roughly 77.4%.
That gap matters more than most traders expect.
A smaller risk cap does not just reduce pain; it keeps the account in the game long enough for normal variance to work in your favour, especially when spreads widen or news moves price sharply.
For traders dealing with volatile Nigerian market conditions, that cushion matters even more.
Sudden currency shocks, thin liquidity at certain hours, and weekend gaps can turn a normal setup into a messy loss very quickly.
How different risk levels affect drawdown and recovery
| Risk per trade | Loss after 5 losing trades | Recovery difficulty | Account survival outlook |
|---|---|---|---|
| 1% | 4.9% drawdown | Easy; a modest winning run repairs the damage | Very strong for long trading cycles |
| 2% | 9.6% drawdown | Manageable; recovery still feels realistic | Strong balance between survival and growth |
| 5% | 22.6% drawdown | Hard; the account must claw back a large chunk | Fragile in choppy or news-driven markets |
remaining equity = (1 - risk)^5.
That is why 2% feels so different from 5%; the loss curve is not linear, and recovery gets harder as drawdown deepens.
The same logic shows up in many forex risk management case studies and risk management success stories.
Traders who keep risk small do not win every week, but they survive the ugly patches that wipe out aggressive accounts.
- 1% risk: Useful when conditions are erratic or spread costs are high.
- 2% risk: Better for traders who want room for normal losses without choking growth.
- 5% risk: Often too heavy for active forex trading unless the edge is unusually strong.
In Nigerian markets, that 2% line is often the difference between a temporary setback and a forced reset.
Slippage on fast moves can make the real loss slightly worse than planned, so the cap should already include a margin for bad fills.
A trader who respects that ceiling can keep trading through rough weeks instead of spending months rebuilding.
That is where the numbers start to matter in a real, practical way.
Winning more trades is not the same as managing risk well
A trader can win more often and still lose money.
That sounds backward, but it happens all the time when losses are allowed to grow faster than gains.
The market does not reward accuracy by itself.
It rewards control, especially when a position moves against you and the pressure to “give it room” starts creeping in.
Checklist: the risk controls every serious trader should test before scaling up
| Checkpoint | Yes/No | Why it matters |
|---|---|---|
| Set a stop-loss before entering | It removes guesswork once the trade is live and keeps emotion out of the exit. | |
| Risk stays within a fixed percentage | It prevents one bad idea from doing outsized damage to the account. | |
| Trades fit a written plan | A plan keeps entries, exits, and trade size consistent across different market conditions. | |
| Loss limits are respected | Daily or weekly loss caps stop revenge trading after a rough stretch. | |
| Position size changes with account size | Size should grow or shrink with equity, not with mood or confidence. |
In many successful trading examples, the edge is not a smarter entry; it is the same trade taken with tighter control, every time.
That difference matters even more in Forex risk management case studies, where one emotional decision can erase a week of careful work.
Strong traders do not ask whether a setup feels right.
They ask whether it still fits their rules after spread, volatility, and account size are all accounted for.
Do this: review each trade after the close and note whether the stop, size, and loss limit were respected.
Do not do this: change the stop after entry just to avoid being wrong, or increase size after a losing streak to “get back” faster.
Do this: compare your best trades with your worst ones and look for repeatable risk habits.
Do not do this: judge your performance only by win rate.
A high hit rate can still hide weak risk control.
The traders who last usually look boring on paper.
Their results come from repeatable limits, not from trying to be right on every trade.
What is the 3-5-7 rule in forex risk management?
The 3-5-7 rule is a survival-focused framework for limiting how much damage you allow before stepping back:- 3 = risk about 3% per trade
- 5 = limit total loss to about 5% over a defined session/run
- 7 = once drawdown reaches roughly 7%, you pause trading to stop a small streak from turning into account-level damage
What is the 3 6 9 theory of trading?
The 3-6-9 theory is a risk/reward and stop-spacing model that uses fixed ratios (commonly interpreted as risking 3 units to target 6 units of profit, with a stop placed wide enough to avoid frequent exits from normal noise—often described as “around 9 units”). The key idea is predefined exits and consistent position sizing, not discretionary “room to breathe.”What is the 7% rule for stop-loss?
There isn’t one universal definition of a “7% rule,” but traders usually mean one of these two things: 1) A price-distance stop (exit if price moves ~7% against the position), or 2) A drawdown boundary that effectively caps how much the position/account can lose before you stop trading. Whichever version you use, make sure it’s consistent with your risk-per-trade calculation (the dollar loss at the stop) so the rule actually prevents outsized damage.Is it possible to make $1000 a day in forex?
It’s possible to make $1000 in a single day, but doing it consistently is rare and usually requires aggressive risk levels that many traders can’t sustain. Risk management determines survival: even a few consecutive losses can erase “great day” gains if you don’t cap per-trade risk (see the 2% vs 5% drawdown example earlier in the article).The Trade Is Only Half the Story
The most useful lesson from the strongest Forex risk management case studies is simple: the traders who last are not the ones who guess best, but the ones who lose small enough to keep playing.
That is why the Nigerian trader’s month mattered so much in the article’s example.
One rule change, a 2% risk cap, turned a shaky run into something stable enough to recover.
Winning more trades still sounds impressive, but it means little if one bad streak wipes out the account.
The real edge shows up in successful trading examples where position size, stop placement, and discipline work together, because those habits protect capital when the market turns messy.
Risk management success stories usually look boring in real time, then brilliant in hindsight.
Set one fixed risk limit before your next trade. Write it down, test it for 20 trades, and check whether your equity curve feels calmer before you even think about changing entries.
If the math still feels unclear, our risk management and equity-curve reviews can help sharpen the numbers without turning the process into guesswork.