
Your account can be green and still be in trouble.
A trader who watches only profit and loss is missing the real story. Forex performance metrics show whether a strategy is steady, fragile, or just lucky on a good week.
That matters because markets do not reward randomness for long.
A proper trading evaluation looks past excitement and asks harder questions: How deep are the losing runs? How much risk produced each gain? Did the edge hold up when spreads widened or emotions ran hot?
Performance tracking is where the truth shows up.
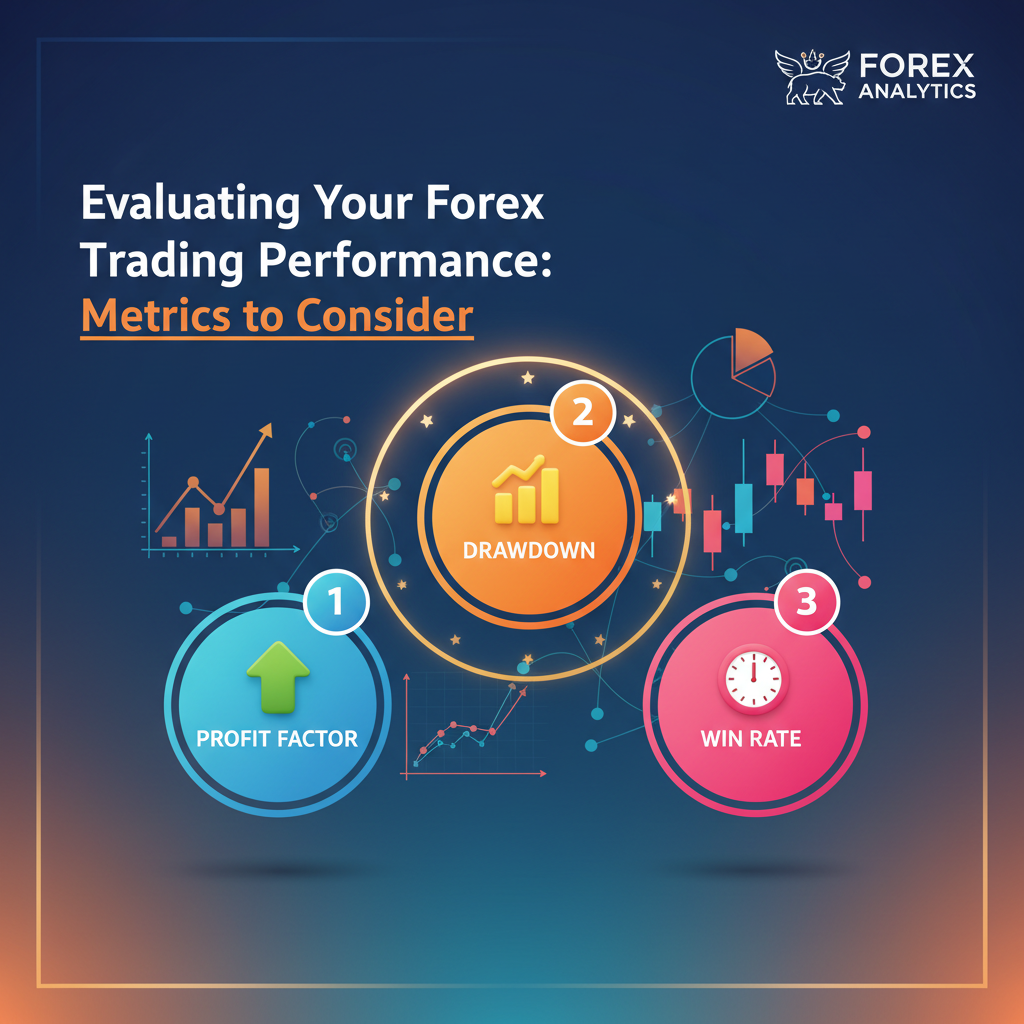
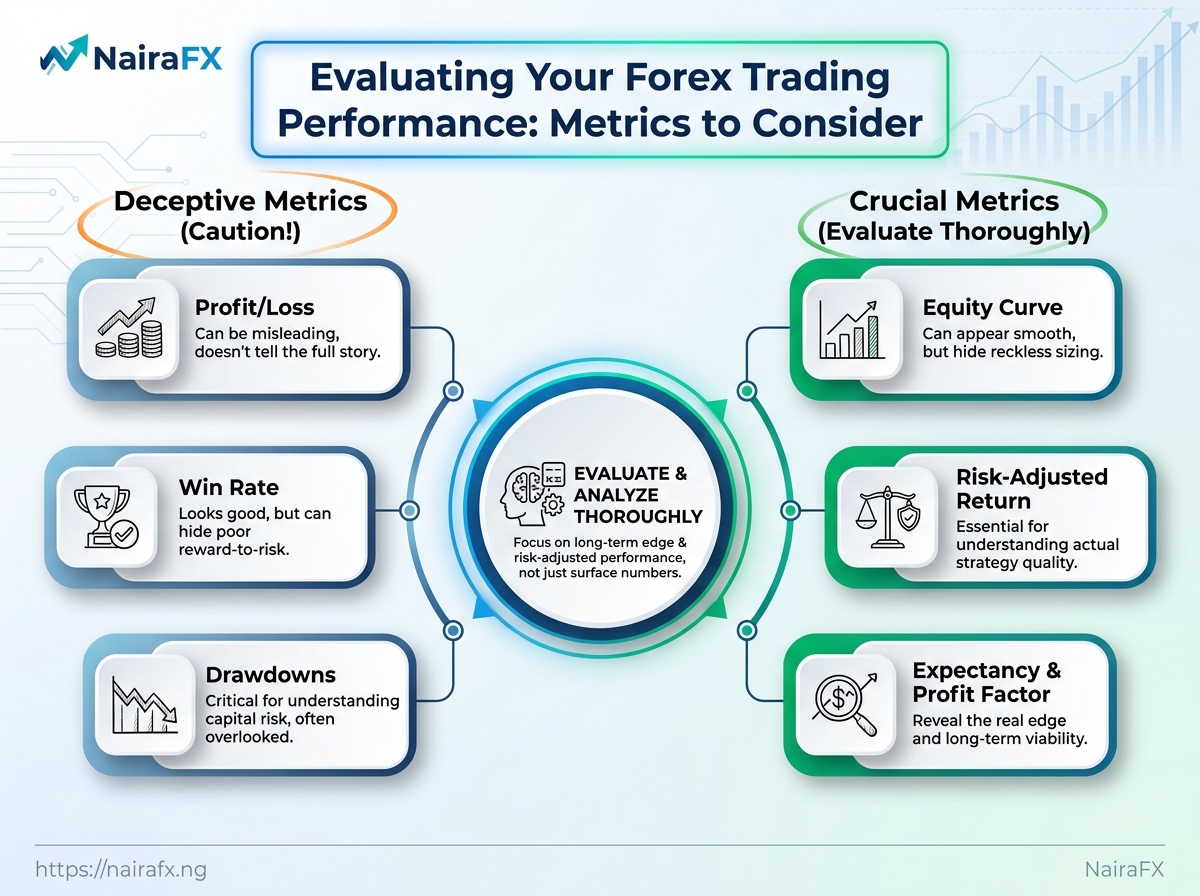
Win rate can look handsome while drawdowns quietly chew through capital, and a smooth equity curve can hide reckless position sizing.
The traders who last are usually the ones who measure what hurts, not just what flatters.
The useful numbers are the ones that make bad habits visible.
Profit factor, expectancy, drawdown, risk-adjusted return, and trade consistency tell a much cleaner story than a lucky month ever will.
Quick Answer: Track forex performance using risk-aware metrics—not profit alone—because a profitable month or high win rate can still be fragile. Evaluate profit factor, expectancy, drawdown (including how deep losing runs are), risk-adjusted return, and trade consistency to see whether your edge survives wider spreads and choppy regimes. Use win rate only with these context metrics so poor reward-to-risk and slow capital erosion become obvious.
A profitable month doesn’t automatically mean your strategy is robust.
That’s why looking at win rate in isolation can mislead you.
Win rate tells you how often trades close in profit, but it doesn’t explain how those profits are earned—how deep the losses get, whether your reward reliably compensates for the risk, or whether you can survive the rough patches.
Risk-adjusted metrics answer the missing question: what did you risk to make that return?
Guides to advanced trading metrics (including Sharpe, Sortino, Calmar, SQN, and K-ratio) and resources like the Sortino ratio explanations from Quantt and TradesViz all point to the same practical idea: downside risk matters more than “harmless” upside noise.
And volatile markets make the gap worse.
A method can look excellent during a trend and then struggle hard in choppy conditions—even when your entry rules stayed the same.
That is the real reason performance tracking belongs at the center of your forex strategy evaluation.
- Win rate without context: A high win percentage can hide poor reward-to-risk, so a “good” system may still bleed slowly.
- Market regime sensitivity: A setup that works in calm conditions can fail quickly when spreads widen and price whipsaws.
- Repeatable edges: Tracking by pair, session, and setup shows where your real strength lives.
The best traders usually stop hunting new ideas and start refining one or two patterns they can trust.
Maybe London session breakouts work well on GBP pairs, while late-session mean reversion keeps getting chopped up.
A simple trading evaluation log makes those patterns obvious.
Once you record entry quality, exit reason, drawdown, and the size of each loss, weak habits stop hiding behind a decent month.
That’s what performance tracking does: it helps you determine whether your results are driven by skill, luck, or temporary market mood—and in forex, the difference matters fast.
The Core Forex Performance Metrics We Should Track
A strategy with a strong win rate can still be a mess.
That sounds harsh, but it happens all the time.
The real test is whether the numbers work together: how often trades win, how much those wins make, how much the losses hurt, and whether the account can survive a rough stretch.
That is why Forex performance metrics need to be read as a set, not one by one.
Trading evaluation gets much sharper when we pair frequency with size, then check whether the equity curve stays sane.
Advanced metric guides from Trading Wyckoff on Sharpe, Sortino, Calmar, SQN, and K-ratio and TradesViz’s Sortino Ratio glossary both make the same point in different ways: upside matters, but downside risk deserves just as much attention.
Win rate tells us how often trades close green. Average win and average loss tell us whether the payoff is worth the pain.
Put those together, and profit factor and expectancy start to show whether the edge is real or just lucky noise.
Drawdown is the reality check nobody enjoys, but everyone needs.
A system can look fine on paper and still become untradeable when losses pile up in a short burst.
That is exactly why downside-focused measures matter, including the kind discussed in Quantt’s Sortino ratio explanation and the International Trading Institute’s review of risk-adjusted return metrics.
Core metrics at a glance
| Metric | What It Measures | Why It Matters | Common Mistake |
|---|---|---|---|
| Win rate | Percentage of trades that finish profitable | Shows how often the strategy is right | Treating it as proof of edge |
| Average win | Mean profit on winning trades | Shows how much a good trade pays | Ignoring how uneven winners can be |
| Average loss | Mean loss on losing trades | Shows the damage from bad trades | Focusing only on the best-case loss |
| Risk-reward ratio | Average win divided by average loss | Shows whether winners can cover losers | Confusing it with win rate |
| Profit factor | Gross profit divided by gross loss | Shows whether profits outrun losses | Trusting it on a tiny sample |
| Expectancy | Expected gain or loss per trade: E = (W% × Avg win) - (L% × Avg loss) |
Shows whether the strategy has positive edge | Forgetting it changes with regime shifts |
Expectancy is usually the cleanest number here because it ties the whole trade profile together.
Drawdown should sit beside every one of these metrics, not after them.
If profit factor looks fine but drawdown keeps deepening, the strategy is probably too fragile, or the position size is too aggressive for real market conditions.
Two traders can both finish up 12% and still be making very different decisions.
One might achieve that return with controlled risk and stable behavior, while the other relies on oversized bets and painful swings.
That’s why raw return alone isn’t enough—it doesn’t describe the risk you had to survive.
In trading evaluation, the clearer story usually comes from Forex performance metrics that compare profit against the risk taken to get it.
Guides like TradingWyckoff’s advanced trading metrics overview and TradesViz’s Sortino ratio definition show how these measures separate steady systems from results that only look steady on the surface.
Reading the numbers together
Sharpe ratio measures return relative to total volatility.
It’s useful when you care about the full “ride” of the equity curve, not just the downside.
Sortino ratio focuses on downside volatility.
That makes it more aligned with reality—most traders don’t lose sleep over upside wiggles, they lose sleep over ugly drawdowns.
Recovery factor asks a simple survivability question: how much profit did you recover relative to how much you fell?
A strategy that earns steadily but suffers steep drawdowns may perform worse here than a slower system with smoother equity behavior.
- Sharpe ratio: Good for a broad read on efficiency, especially when up/down movement is similarly meaningful.
- Sortino ratio: Better when downside pain is what you’re trying to control.
- Recovery factor: Handy for judging whether a strategy can survive a rough patch and still earn its way back.
- Position sizing: risk per trade changes what each ratio “means.”
The same percentage return can reflect very different behavior if one trader used consistent risk and the other used large, uneven bets.
A clean equity curve matters, but the size and consistency of each bet matter just as much.
If risk per trade is all over the place, performance tracking becomes harder to interpret—the numbers stop describing the strategy and start describing your variability.
A durable system typically shows decent returns, controlled drawdown, and sane position sizing.
Taken together, that combination signals quality far better than a flashy profit figure.
How to Review Trades Without Emotional Bias
A trade feels very different after the close than it did in the moment.
That is where emotional bias sneaks in and rewrites the story, especially after a win or a painful loss.
A clean review process keeps the trade anchored to facts.
The simplest version is plain: compare the trade against the plan, check the risk, then read the journal entry before you judge the result.
For performance tracking, the journal should do more than record profit and loss.
It needs the setup, the reason for entry, the exit reason, and any moment where fear, hesitation, or revenge trading showed up.
That’s also why downside-focused measures matter in trading evaluation.
Resources like the Sortino ratio guide and the broader advanced trading metrics overview are useful when you want to see whether losses are coming from the market or from bad decisions.
Simple trade review checklist
| Review Question | Yes/No | Notes | Action to Take |
|---|---|---|---|
| Did we follow the plan? | Yes | Entry, stop, and target matched the written setup. | Keep this setup in the rotation. |
| Was risk per trade within limits? | Yes | Position size stayed inside the preset risk cap. | No change needed. |
| Did emotion affect the exit? | No | Exit was based on the rule set, not panic or greed. | Keep reviewing for consistency. |
| Did the setup match our rules? | Yes | All required conditions were present before entry. | Keep the setup in play. |
| Was the journal completed? | No | Notes were missing right after the session. | Fill the journal before the next trade. |
If the rule-based trades hold up while the emotional ones fall apart, the problem is discipline.
If the rule-based trades keep failing across different market conditions, the strategy itself needs work.
That split saves a lot of wasted effort.
It stops traders from blaming themselves for a weak edge, and it also stops them from blaming the edge when the real issue is poor execution.
Turning Metrics Into Better Trading Decisions
Which setups deserve another week of capital, and which ones are just noise with good manners?
That question sits at the heart of real trading evaluation.
A metric only matters when it changes a decision, and the best Forex performance metrics tell us where to press harder, where to pause, and where to stop pretending a weak setup is “still in development.”
A clean way to think about it is this: the same strategy can look fine on raw returns and still be poor once downside risk, drawdown shape, and consistency are put under the microscope.
Guides on advanced trading metrics such as Sharpe, Sortino, Calmar, SQN, and K-Ratio make that point very clearly, because each one answers a different question about performance (TradingWyckoff’s guide to advanced trading metrics).
Which setups deserve more attention
A setup earns more attention when the improvement shows up across more than one measure.
If the win rate rises but average loss grows faster, that is not progress.
If returns improve while downside deviation stays controlled, that is worth a closer look.
For this reason, Sortino Ratio is especially useful when the real worry is ugly losses rather than normal price wobble.
It focuses on downside risk, not all volatility, which makes it a better fit for many trading decisions than a broad volatility measure alone (TradesViz on Sortino Ratio; Quantt on Sortino ratio explained for 2026).
- Give more weight to setups that improve returns without increasing ugly drawdowns.
- Watch consistency, not just one lucky streak.
- Prefer cleaner equity curves over flashy bursts of profit.
- Track downside deviation when losses matter more than daily noise.
When to stop, adjust, or keep testing
A strategy should stop getting a free pass once its edge stops surviving different market conditions.
If it only works in one type of volatility, one session, or one currency pair, it is fragile.
That is where a simple rule helps: keep testing when the pattern is inconsistent but not broken, adjust when the logic still makes sense but the execution is weak, and stop when the edge disappears after enough trades to matter.
A 2026 discussion of forex improvement methods also points to risk controls, position sizing, and automation as the levers that usually separate a fragile setup from one that can survive live markets (Mattioli1885 Journals 2026 comparison of top forex trading strategies).
For Nigerian traders, that means checking performance across different market moods, not just one calm month.
Naira swings, dollar strength, and local liquidity shifts can change how a setup behaves, so progress should be tracked by market regime, not by account balance alone.
The best decisions come from matching the metric to the question.
Once that habit sticks, performance tracking starts feeling less like paperwork and more like edge detection.
Turn Profit Into Proof
Profit can flatter a weak strategy for a while, but forex performance metrics tell you whether the edge is real or just lucky.
Once you start looking at drawdown, expectancy, win rate, and risk-adjusted measures, the story changes fast.
A trading plan that grows slowly with controlled losses is usually healthier than one that spikes hard and bleeds quietly in the background.
That was the whole point of comparing raw returns with the quality of the path.
A system can look fine on paper and still be fragile if one bad streak wipes out months of progress, which is why proper trading evaluation matters more than a pretty P&L line.
Emotional reviews make this worse, because traders remember the biggest win and forget the messy middle where most bad habits hide.
Start a simple performance tracking habit today: pull your last 20 trades, record the setup, risk, result, and maximum drawdown, then ask whether the numbers support the story you tell yourself.
If the answer feels fuzzy, that is the market telling you to slow down and measure better.
For traders who want a deeper review, our risk management and equity-curve work can help turn those numbers into decisions that actually hold up.